Clear Sky Science · en
Beyond the middle: rethinking midpoint and “no idea” options in Likert scale for consumer sensitive issues
Why the middle of a survey really matters
Many of us have clicked through online surveys, choosing options from “strongly disagree” to “strongly agree,” often landing in the middle or picking “no idea.” This study shows that those small design choices in rating scales can quietly reshape what researchers think consumers believe, especially when the topic feels socially sensitive, like alcohol use. Understanding how the middle and “no idea” options work helps explain when survey results reflect real opinions and when they are distorted by hesitation, social pressure, or confusion.
How simple questions can hide complex behavior
The researchers focused on one of the most common survey tools in marketing: the Likert scale, where people rate their agreement with statements. Past work has shown that people often fall into patterns, such as always choosing extreme ends, always agreeing, or repeatedly selecting the middle option. At the same time, people also tend to answer in ways that make them look good, especially on socially delicate topics. This study argues that these two forces response style and social desirability cannot be treated separately if we want surveys to capture what consumers truly think.
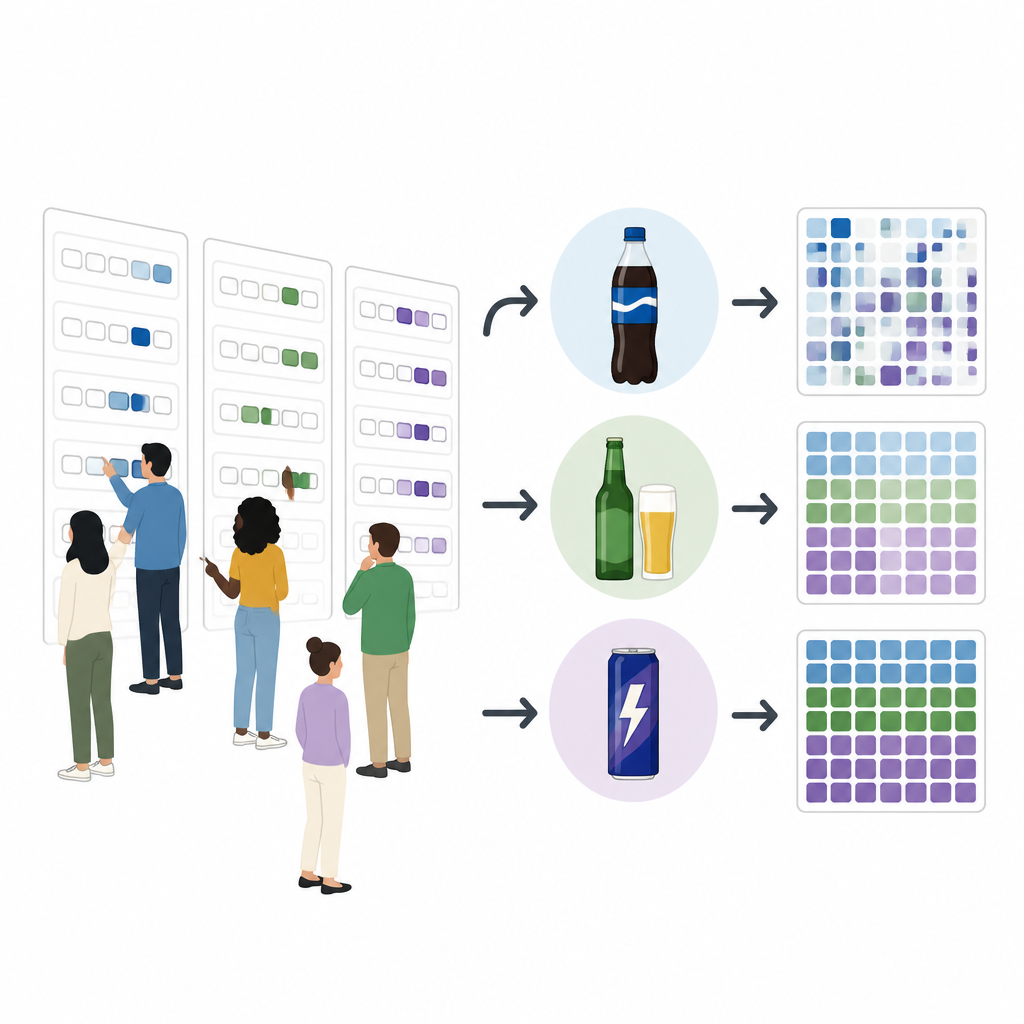
Testing scale designs with everyday drinks
To explore this link, the authors surveyed 1333 university students in Turkey about three beverages: coke, an energy drink, and beer. Coke and the energy drink were treated as ordinary products, while beer was treated as sensitive, because drinking alcohol can be frowned upon in many parts of Turkish society. Students were randomly given one of four versions of the rating scale: a forced 4 point scale without a middle option, the same 4 point scale with an added “no idea” choice, a standard 5 point scale with a middle option, or a 5 point scale plus “no idea.” This design let the team see how people shifted their answers when the middle or “no idea” options were available.
What happened when “no idea” was available
The way people used the “no idea” choice turned out to depend heavily on the product. For coke and the energy drink, many respondents moved from the neutral middle of the 5 point scale to “no idea” once that option appeared, suggesting they had been using the midpoint to signal uncertainty. For beer, the pattern was different. Here, the largest shifts toward “no idea” came from people who had previously chosen the most negative answer. In other words, when given the chance, some respondents stopped openly expressing strong disapproval of beer and instead retreated into a safer, non committal choice, a pattern consistent with social pressure around alcohol.
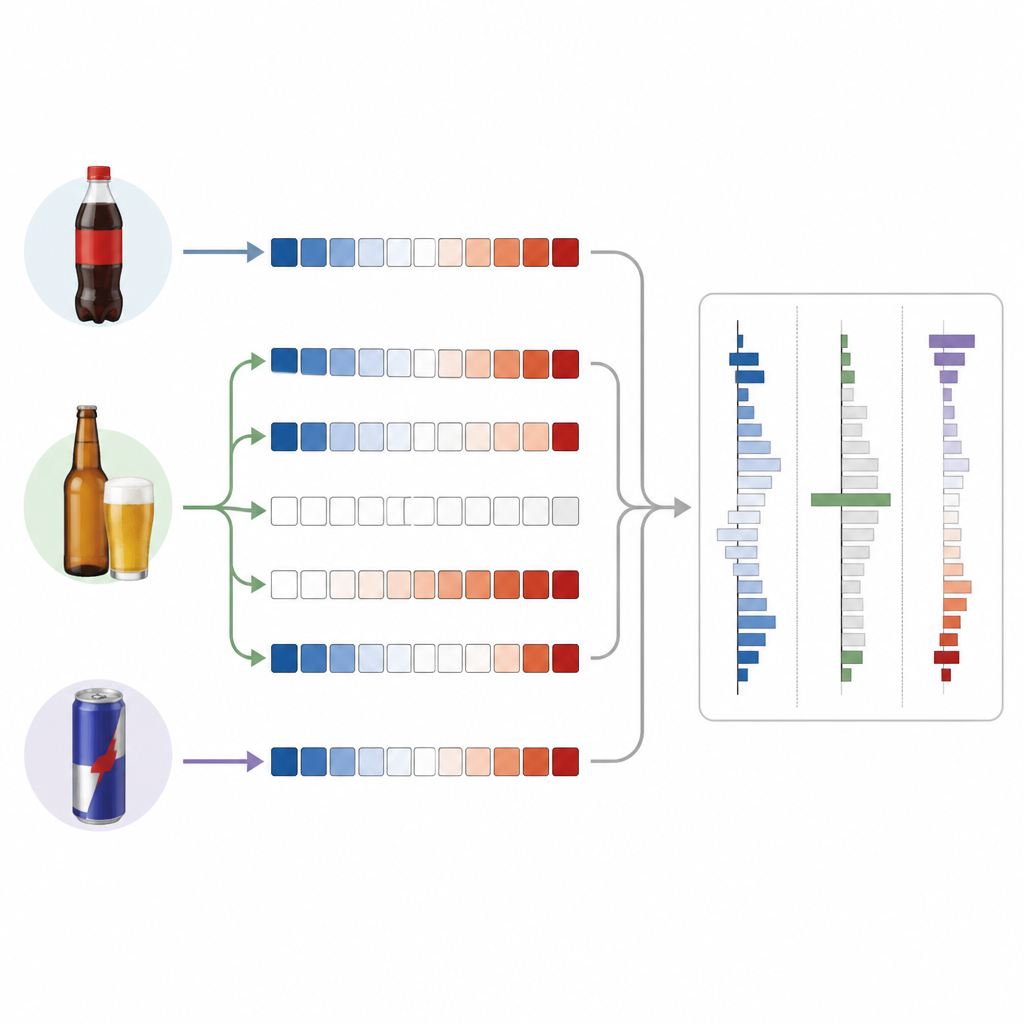
How the middle option reshapes answers
The middle point itself also behaved differently across products. Overall, adding a midpoint reduced the use of extreme answers and encouraged more moderate responses, but this effect was strongest for coke and the energy drink. For these non sensitive items, people seemed comfortable shifting toward the center when it was offered. For beer, however, the presence of a midpoint and a “no idea” option interacted with social norms in a subtler way. Instead of simply softening opinions, these options provided escape routes: some respondents used them to avoid both harsh criticism and open approval of a product linked to contested moral and political debates.
Why one standard survey scale is not enough
By comparing response patterns across beverages and scale formats, the authors show that survey design and topic sensitivity are tightly intertwined. The same 4 or 5 point scale behaves differently when the product is socially neutral versus socially charged. This means that there is no single “best” Likert scale that works for every topic. For routine subjects, using a middle point or a “no idea” option can help capture genuine uncertainty. For sensitive issues, those same options can hide true feelings behind apparently neutral answers. The study concludes that researchers and marketers must choose their scales with the topic in mind, carefully balancing midpoint and “no idea” choices if they want survey data to reflect what people really think, rather than what they feel safe saying.
Citation: Kurtuluş, K., Basfirinci, C. & Cilingir Uk, Z. Beyond the middle: rethinking midpoint and “no idea” options in Likert scale for consumer sensitive issues. Humanit Soc Sci Commun 13, 711 (2026). https://doi.org/10.1057/s41599-026-07037-x
Keywords: Likert scale, response bias, social desirability, consumer surveys, sensitive topics