Clear Sky Science · en
Assessing smart city maturity through a multidimensional DP2-based clustering of the IMD smart city index
Why city “smartness” is more than gadgets
As more places race to call themselves smart cities, leaders often lean on simple rankings that crown winners and losers. But these league tables can hide an important question for residents: is technology actually making everyday life better, fairer, and greener in a balanced way? This study argues that real smart city maturity is not about who is number one, but about how well different pieces of urban life fit and work together.
Looking beyond one big score
Traditional smart city indexes squeeze many indicators into a single score and a neat list. That makes for easy headlines but can blur the difference between a city rich in digital gadgets and one that is quietly strong in schools, parks, or basic services. The authors show that cities with very different patterns of development can land next to each other in the same rank. In such lists, high marks in transport or connectivity can hide weak spots in air quality, safety, or housing. This study proposes a different lens: view maturity as a balanced pattern across several areas, not as a straight ladder of smartness.
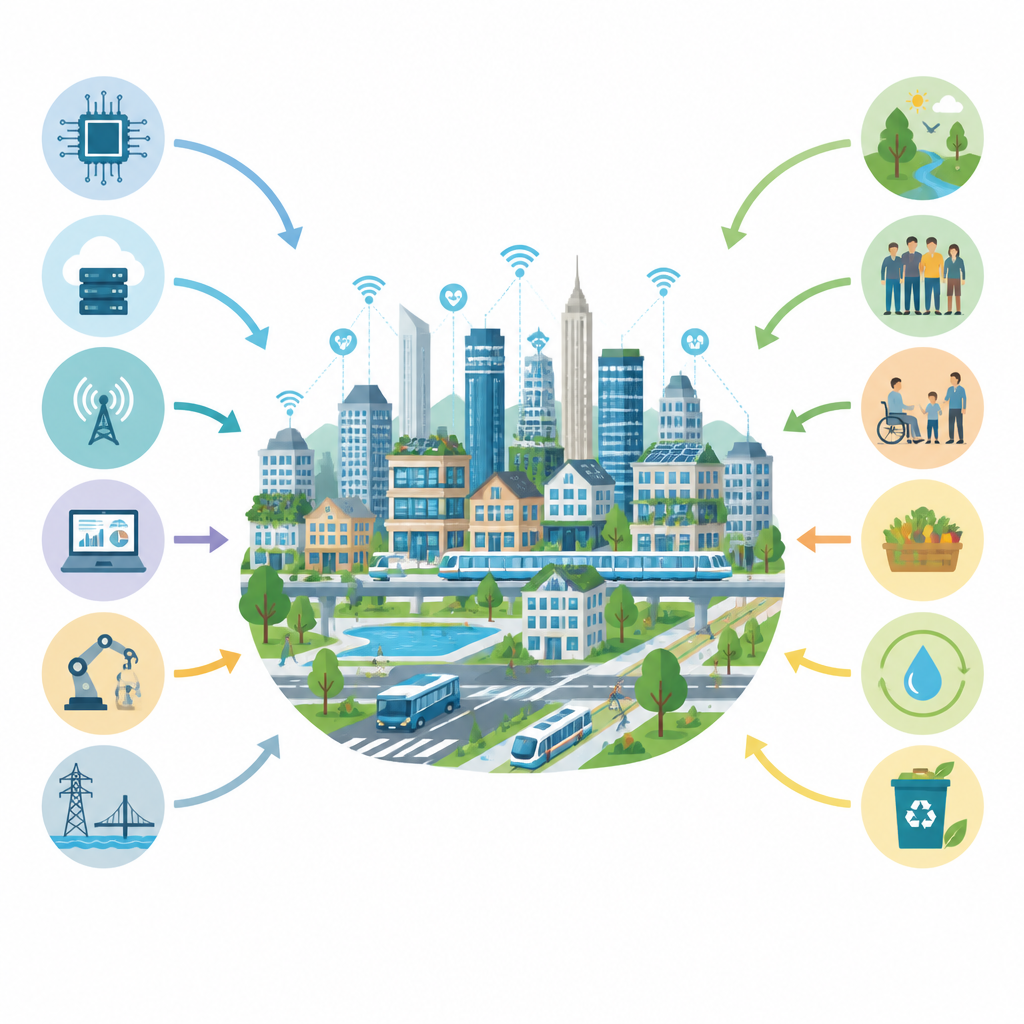
Six everyday pillars of a mature smart city
To make this idea concrete, the researchers group citizen survey answers from the IMD Smart City Index 2024 into six policy-friendly domains. These cover digital readiness, infrastructure and mobility, environmental quality, community and economic resilience, proximity and livability, and circular economy and resource management. Together, they describe how people experience city services, from Wi-Fi and public transport to green spaces, safety, and recycling. The key principle is non-compensation: shining in one pillar cannot fully make up for neglect in another. A city packed with apps but short on clean air or affordable housing would not count as truly mature.
A new way to combine and compare city data
Instead of a simple average, the team uses a distance-based method known as DP2 to build a score for each of the six domains in every city. This approach reduces the influence of overlapping indicators so that repeated questions do not unfairly boost a domain. It also avoids assigning arbitrary weights that might favor fashionable themes like digital infrastructure over quieter ones such as social cohesion. The result is a set of six condensed measures per city that still reflect the rich, multidimensional reality behind residents’ perceptions of how their city works.
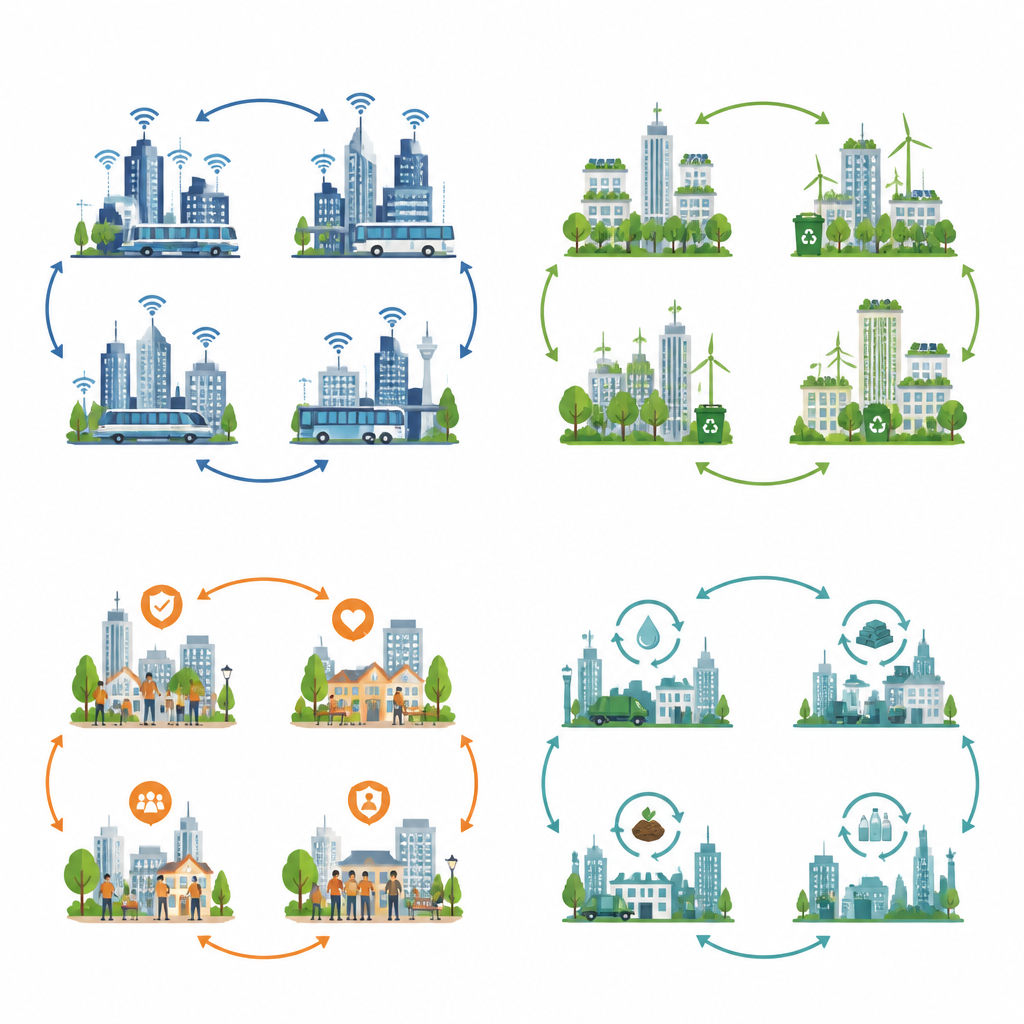
Four distinct profiles rather than a single race
With these six domain scores in hand, the authors then group cities using hierarchical clustering. Instead of ranking, this method looks for cities that share similar patterns of strengths and weaknesses. It reveals four main maturity profiles, nicknamed digital, smart-sustainable, resilient, and circular. One group shows high and balanced scores across most domains, especially environment and resource use. Another leans on infrastructure and community strength. A third sits in the middle with uneven performance, while a fourth lags in several areas, particularly livability and circular practices. Importantly, these clusters are not value labels or steps on a fixed path, but descriptive portraits of different ways cities are evolving.
What this means for people and policy
The study finds that while a city’s maturity profile is related to its overall rank, the two are not the same thing. Cities close together in a ranking can belong to very different profiles, which means they face different trade-offs and options. For residents and decision makers, this more nuanced picture matters. It helps them see whether progress in one area is being matched elsewhere, and where specific gaps remain. The authors argue that profiling smart city maturity in this way should sit alongside, not replace, familiar rankings. Used together, these tools can better guide plans for urban development that value balance between technology, environment, society, and resources rather than a narrow race to the top of a list.
Citation: Ivaldi, E., Pavanini, T., Filì, T. et al. Assessing smart city maturity through a multidimensional DP2-based clustering of the IMD smart city index. Sci Rep 16, 14806 (2026). https://doi.org/10.1038/s41598-026-39682-2
Keywords: smart city, urban maturity, city clustering, urban sustainability, citizen perception