Clear Sky Science · en
Graph neural network modeling of spatial tumor-immune interactions identifies prognostic cellular niches in non‑small cell lung cancer
Why the neighborhood around a tumor matters
Lung cancer is often described in terms of genes and drugs, but this study shows that where cells sit next to each other inside a tumor can be just as important as what those cells are. By zooming in on millions of individual cells from patients with non-small cell lung cancer, the researchers used an artificial intelligence approach to read the “social network” of tumor and immune cells. They found that certain local cell neighborhoods are strongly linked to how long patients live, offering a path to more precise predictions and, potentially, smarter immunotherapy choices.
Looking at cancer as a living city
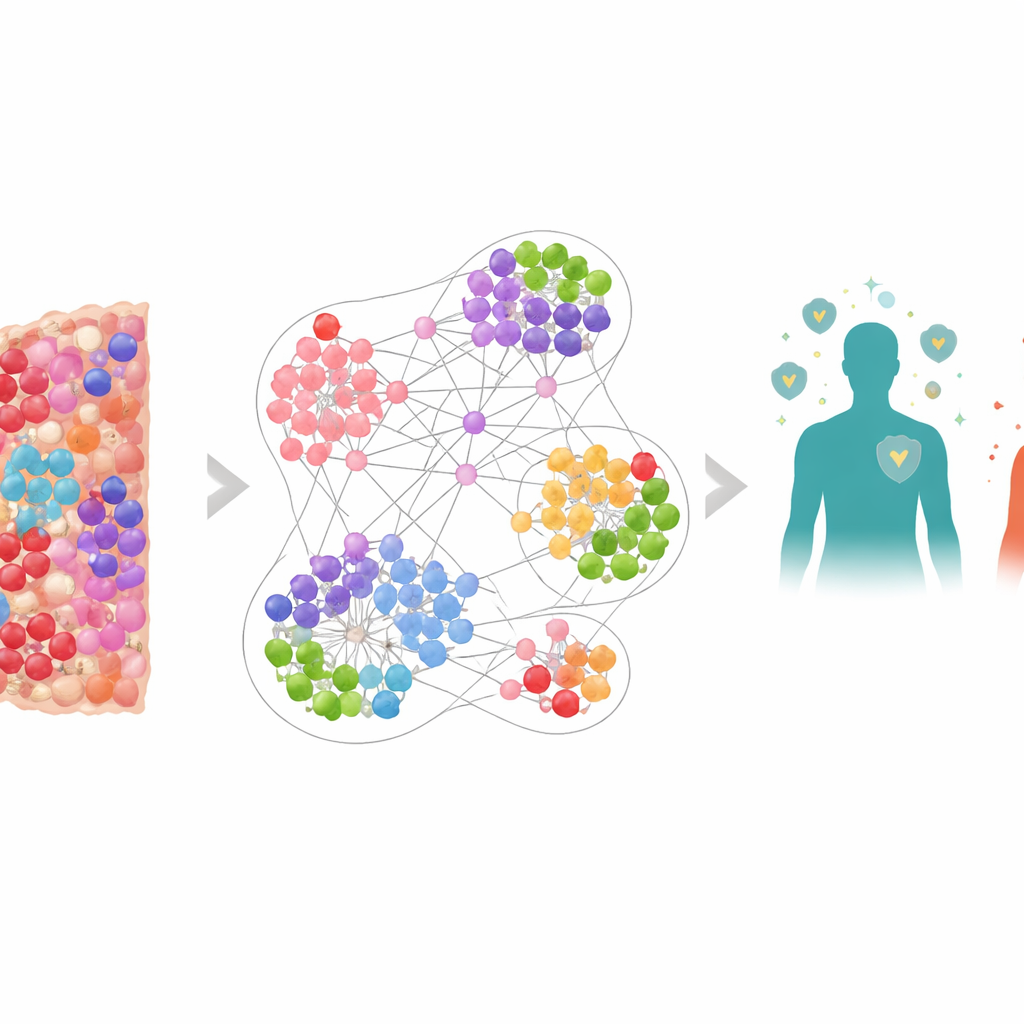
Instead of treating a tumor as a uniform mass, the team viewed it as a crowded city made up of many different residents: cancer cells, defender immune cells, and suppressor cells that blunt the immune attack. Using a special imaging method that stains multiple markers at once, they mapped over 6.9 million cells from biopsy samples of 506 lung cancer patients. Each cell’s position and identity were recorded, including key players like killer T cells (CD8+), immune “brakes” such as PD-1 and PD-L1, and regulatory T cells marked by FOXP3. This produced highly detailed maps of the tumor microenvironment, the immediate surroundings where tumors and immune cells constantly interact.
Turning cell maps into a network model
To make sense of such complexity, the researchers built a graph neural network, a type of AI designed to work on networks rather than simple tables of numbers. In their model, every cell is a node and neighboring cells are connected by links, forming many overlapping “neighborhood graphs” around each cell. The network was trained to learn which kinds of local neighborhoods tended to appear in patients who lived longer versus shorter. When the model’s neighborhood-level predictions were averaged up to the patient level, it predicted survival very accurately, outperforming simpler measures like how many killer T cells are present overall or models that only knew where cells were but not what they expressed.
Good and bad neighborhoods inside the tumor
By dissecting what the AI had learned, the team identified distinct types of local neighborhoods with very different implications for survival. Neighborhoods rich in killer T cells, especially when tumor cells also expressed markers of immune activation, were generally linked to better outcomes. But not all crowded immune areas were beneficial. Some neighborhoods mixed many killer T cells with high levels of PD-L1 on tumor or nearby immune cells, signaling strong immune “shutdown” and worse survival. Other neighborhoods were more like immune deserts, dominated by tumor cells with very few defenders, and these were also tied to poor outcomes. By clustering these patterns, the study defined several recurring tumor “states” that balanced immune attack versus immune escape.
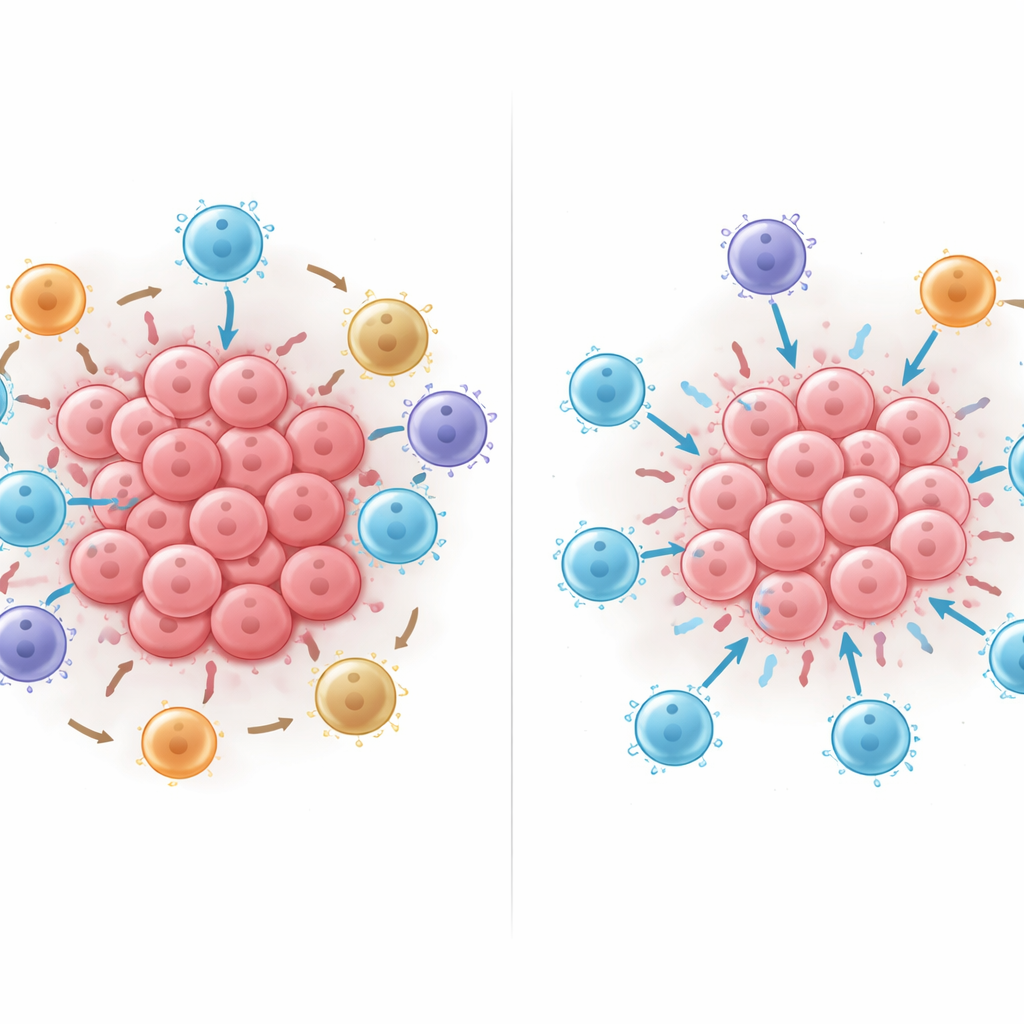
What happens when you rearrange the cells
The researchers then used the trained AI model like a virtual laboratory, digitally adding, removing, or moving cells inside neighborhoods to see how predicted survival changed. Adding killer T cells almost always helped, but it helped most when those cells were in direct contact with tumor cells rather than kept at arm’s length. Moving suppressive PD-L1–positive immune cells or FOXP3-positive regulatory T cells into close contact with killer T cells consistently reduced the model’s survival prediction, and the harm grew as more such contacts were created. These in-silico experiments suggest that physical contact patterns—who touches whom—can sharply tilt the balance between effective tumor attack and immune suppression.
How this could shape future cancer care
For a layperson, the key message is that not all tumors with “a lot of immune cells” are equal. This study shows that tiny neighborhoods—often just a few dozen cells—can carry powerful signals about whether the immune system is winning or losing the local battle, and these signals predict how patients fare even after accounting for tumor stage or whether they received immunotherapy. By providing a blueprint for reading these spatial patterns with advanced AI, the work points toward next-generation tests that go beyond counting cells to measuring how they are arranged. Such spatial biomarkers could help doctors better identify which patients are likely to benefit from immune-based treatments and which might need combination strategies that disrupt harmful cell neighborhoods or boost helpful ones.
Citation: Hoebel, K.V., Lindsay, J.R., Altreuter, J. et al. Graph neural network modeling of spatial tumor-immune interactions identifies prognostic cellular niches in non‑small cell lung cancer. npj Precis. Onc. 10, 158 (2026). https://doi.org/10.1038/s41698-026-01314-3
Keywords: non-small cell lung cancer, tumor microenvironment, graph neural networks, spatial immunology, immunotherapy biomarkers