Clear Sky Science · en
STHELAR, a multi-tissue dataset linking spatial transcriptomics and histology for cell type annotation
Why looking at cancer under the microscope is not enough
Cancer doctors still rely heavily on what they see through the microscope: thinly sliced, pink‑and‑purple tissue stained with hematoxylin and eosin (H&E). These images reveal shapes and patterns, but they cannot directly show which genes are active inside each cell. A new resource called STHELAR brings these two worlds together, linking the familiar view of tissue slides to cutting‑edge “spatial” measurements of gene activity. For readers, this work matters because it opens the door to faster, cheaper tools that may one day read the molecular makeup of tumors from ordinary digital images alone.
Seeing the tumor as a crowded neighborhood
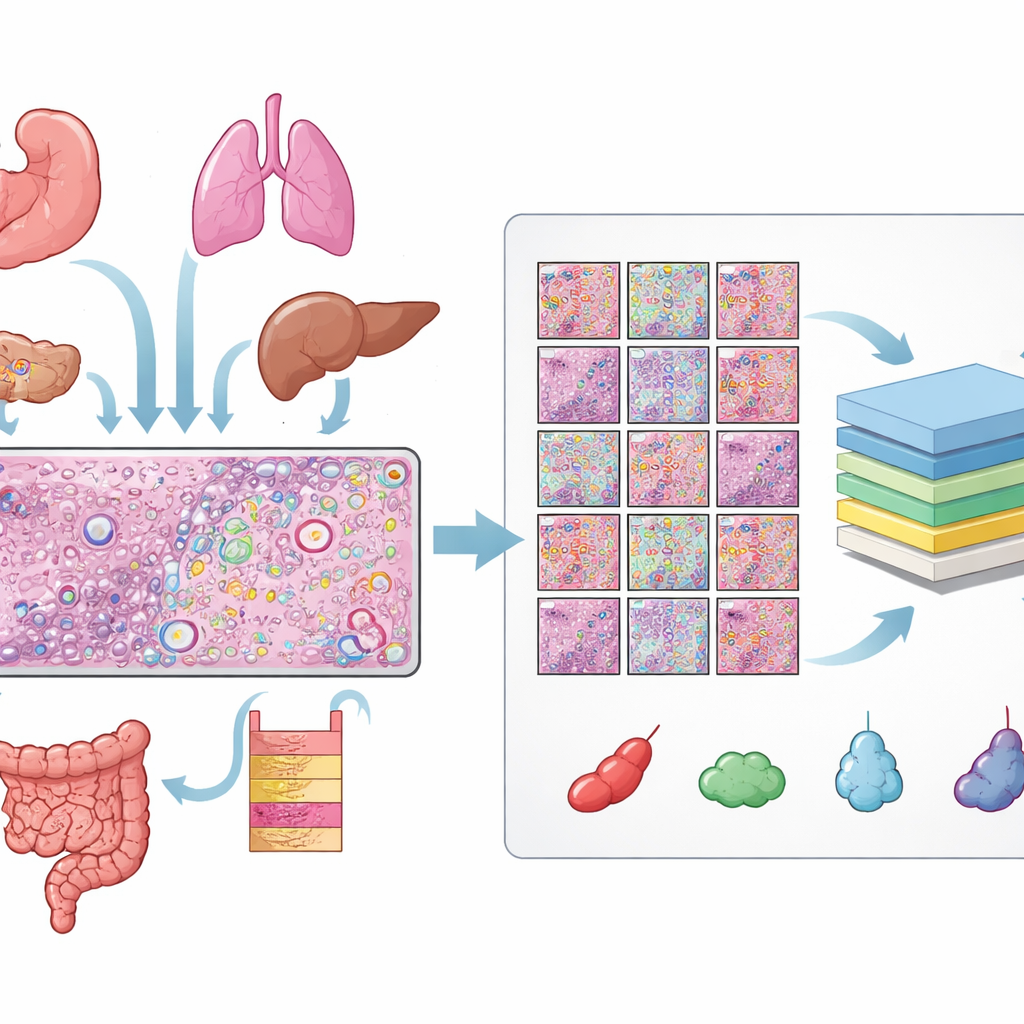
Tumors are more than rogue cancer cells; they are crowded neighborhoods filled with immune cells, blood vessels, support cells, and normal tissue. The mix and arrangement of these residents—the tumor microenvironment—can shape how a cancer grows and how it responds to treatment. Spatial transcriptomics, a recent technology, can map which genes are turned on in individual cells while preserving their precise position in the tissue. However, these experiments are costly and technically demanding, so they are not yet part of routine care. In contrast, high‑resolution scans of H&E slides are now common, cheap to store, and already used worldwide. The central idea behind STHELAR is to use a limited set of spatial transcriptomics experiments as a “teacher” for millions of cells seen in standard H&E images.
Building a huge library of labeled cells
The authors gathered data from 31 tissue sections measured with 10x Genomics’ Xenium spatial transcriptomics platform, covering 16 types of human tissue and 22 cancer and 9 non‑cancer samples. For each section, they had three matched views: an H&E slide, a fluorescent image showing cell nuclei, and a map of individual RNA molecules. Aligning these views required careful quality checks and, for many slides, manual fine‑tuning so that every nucleus in the fluorescent image lined up with the corresponding structure in the H&E slide. From these aligned images they obtained over 11 million distinct cells and more than half a million small H&E patches, each with precise outlines of every nucleus.
Teaching the computer what each cell type is
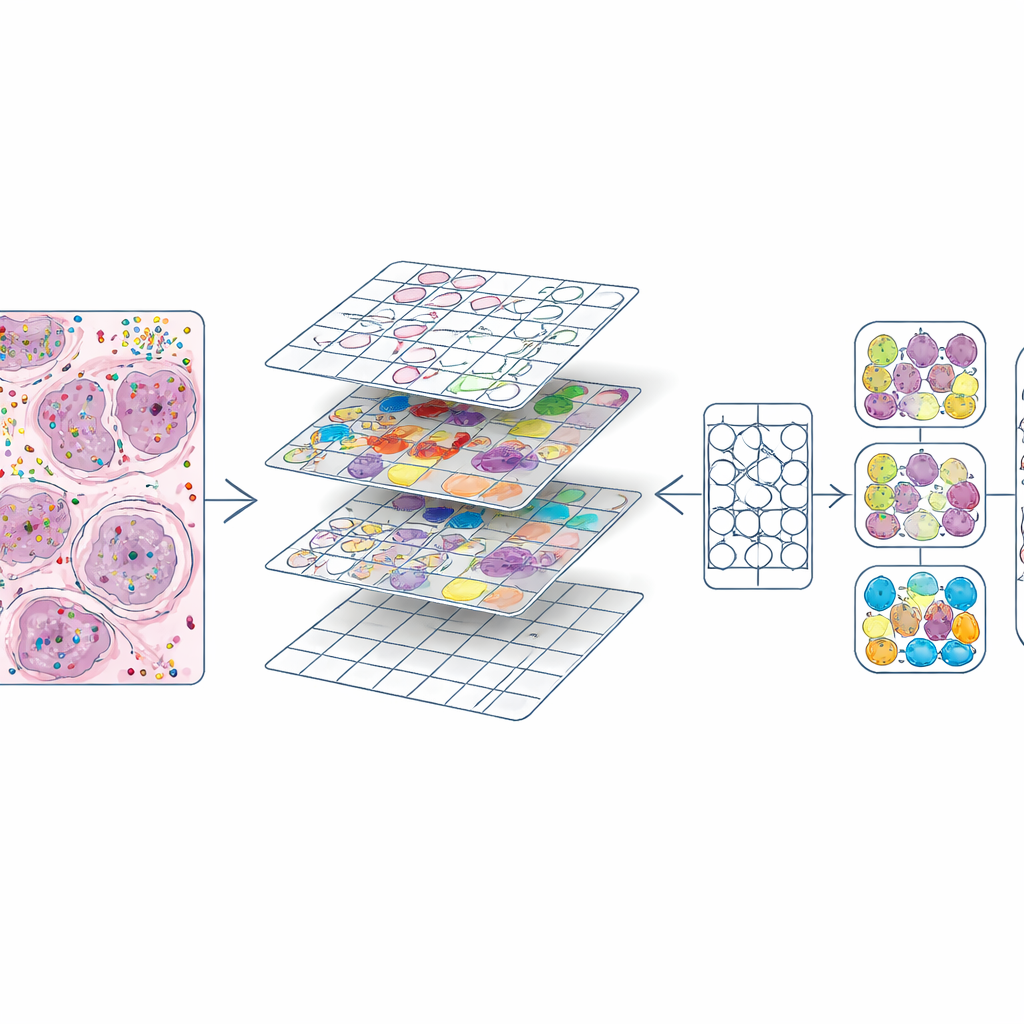
Knowing where each cell sits is not enough; the crucial step is deciding what kind of cell it is. To do this, the team combined spatial transcriptomics with large existing catalogs of single‑cell RNA profiles. Using a method called Tangram, they first transferred likely cell identities from these reference atlases onto the spatial data. They then improved these preliminary labels by grouping cells into clusters based on their gene activity and examining which genes distinguished each cluster. When marker genes and Tangram agreed, labels were accepted; when they disagreed, the local gene patterns in the tissue took precedence. Finally, they harmonized the results across all slides into ten broad categories such as epithelial, blood vessel, immune cell groups, fibroblasts, melanocytes, and a catch‑all “other” group. A pathologist visually inspected the results on the H&E images to ensure that the labels made biological sense.
Turning rich molecular maps into training material
Once every cell had both a position and a type, the authors cut each H&E slide into small squares, similar to image tiles in a photo‑editing program. For each tile they produced two key ingredients: a mask outlining every nucleus and a color code indicating its cell type. This created about 587,000 tiles at high magnification and a slightly smaller set at lower magnification. They also compared their nucleus outlines to those produced automatically by an existing deep‑learning model (CellViT) and computed agreement scores, allowing future users to filter out lower‑quality regions. All of this information—images, masks, gene counts, cell labels, and quality scores—is bundled into standardized data objects so that researchers can easily explore or reuse the dataset.
Showing that computers can learn from the new atlas
To demonstrate what STHELAR enables, the team fine‑tuned the CellViT model, a powerful vision transformer designed for segmenting and classifying cells in H&E images. Using STHELAR’s labels as ground truth, they trained the model to recognize nine detailed cell classes and, in a second experiment, five broader groups (for example, combining several immune cell types). The fine‑tuned model kept strong performance at detecting and outlining nuclei and achieved good accuracy for visually distinctive cells such as epithelial cells and melanocytes, while more subtle immune subtypes remained challenging. They also checked their annotations against an independent labeling method (SingleR) and alternative RNA‑based models, generally finding good agreement.
What this means for future cancer diagnosis
STHELAR is less a single algorithm than a reference atlas: an open, large‑scale link between what pathologists see on standard H&E slides and what spatial transcriptomics reveals about gene activity in each cell. For non‑specialists, the takeaway is that this resource makes it far easier to train and test computer models that can infer the cellular makeup of tumors directly from routine images, without having to run expensive molecular assays for every patient. As such models improve, they could help doctors read the invisible molecular “conversation” inside tumors from ordinary slides, supporting more precise diagnoses and better‑tailored treatments.
Citation: Giraud-Sauveur, F., Blampey, Q., Benkirane, H. et al. STHELAR, a multi-tissue dataset linking spatial transcriptomics and histology for cell type annotation. Sci Data 13, 665 (2026). https://doi.org/10.1038/s41597-026-06937-6
Keywords: tumor microenvironment, spatial transcriptomics, histopathology imaging, cell type annotation, deep learning in cancer