Clear Sky Science · en
scTWAS: a powerful statistical framework for single-cell transcriptome-wide association studies
Why looking at single cells can change medicine
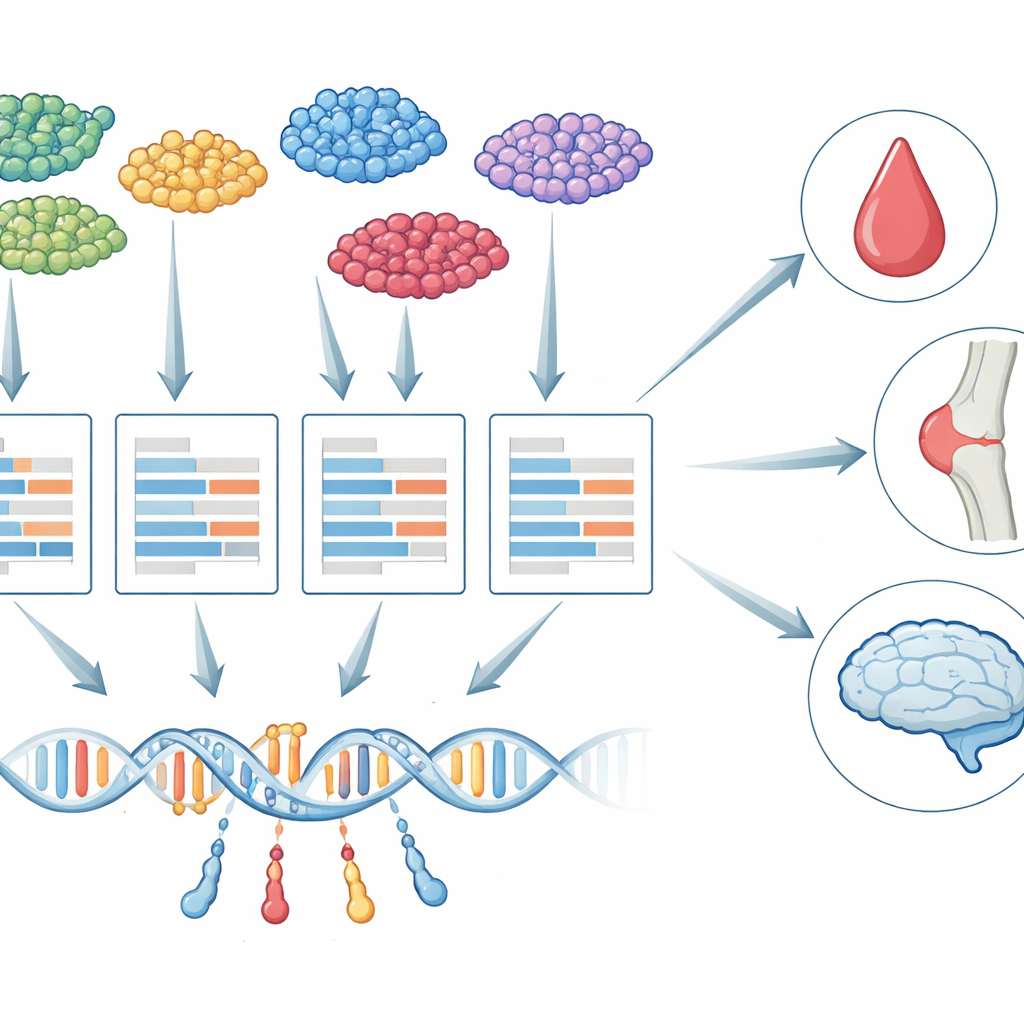
Most genetic studies of disease work like listening to a crowd: they hear an overall roar but miss what each person is saying. This paper shows how to tune our ears to individual voices. The authors introduce scTWAS, a new way to connect DNA differences to disease by looking at gene activity in specific cell types and even finer cell subtypes, using single-cell RNA sequencing data. That sharper view uncovers which exact cells—and which genes inside them—are driving conditions such as blood disorders, autoimmune diseases, and Alzheimer’s disease.
From bulk tissue to single cells
For more than a decade, researchers have used a strategy called transcriptome-wide association studies (TWAS) to link genetic variants to diseases. TWAS works in two steps: it first learns how DNA changes influence gene activity, then tests whether the genetically predicted activity of each gene is tied to a trait such as platelet count or dementia risk. Until now, nearly all TWAS work has relied on “bulk” tissue samples, where RNA from many cell types is blended together. That blending hides important differences: the genetic control of a gene in a microglial cell in the brain, for example, can be very different from the same gene in a neuron, and only some of those cells may truly matter for a given disease.
The problem with noisy single-cell data
New population-scale single-cell RNA sequencing now makes it possible to measure thousands of individual cells per person, across many people. But these data are messy: counts are sparse (many zeros), strongly affected by technical quirks of the experiment, and vary greatly from cell to cell even when biology is the same. Earlier attempts to plug single-cell data into TWAS used ad hoc normalization tricks borrowed from bulk RNA methods, hoping those steps would tame the noise. The authors show that such shortcuts can distort the true genetic effects on gene activity, leading to weaker predictions and fewer discovered gene–disease links, especially in rare or difficult cell types.
How scTWAS cleans the signal
scTWAS tackles these challenges by explicitly separating biology from measurement error. First, it aggregates single-cell counts within each person and cell type into a “pseudo-bulk” profile, reducing sparsity while preserving cell-type identity. Then it uses a two-layer statistical model: one layer describes how DNA variants and basic characteristics like age influence a person’s true underlying gene activity in a given cell type; the other layer models how the sequencing machine turns that activity into noisy counts, including the effect of varying sequencing depth. By fitting this model with a specialized weighted regression algorithm, scTWAS downweights the noisiest samples and more accurately estimates genetically regulated expression for each gene in each cell type.
Finding disease genes where they really act
Once these cell-type-specific prediction models are trained, scTWAS plugs them into large genome-wide association studies to test for gene–trait links. In simulated data mimicking real single-cell experiments, scTWAS consistently outperformed existing methods in both prediction accuracy and power, with especially large gains for rare cell types where data are scarcest. Applying the framework to immune cells, the authors show that scTWAS identifies substantially more genes associated with 29 blood traits and with rheumatoid arthritis, lupus, and asthma. Many of these signals highlight particular immune cell types—such as specific monocyte or T cell subsets—as the main stage on which certain genes affect disease risk, and some associations were missed entirely by bulk blood analyses.
Peering into brain cell subtypes in Alzheimer’s
scTWAS becomes even more revealing in the brain. Using single-nucleus data from hundreds of donated human brains, the authors built prediction models for six major brain cell types and 75 finer subtypes. They then combined these with Alzheimer’s disease genetic data to map where, at cellular resolution, risk genes are likely acting. Some genes appear across many cell types, suggesting broad roles in the brain, while others are strikingly specific. For example, a known risk gene, MS4A6A, shows a strong association only in a disease-associated microglial subtype linked to lipid handling, and PPP1R37 is associated only in an inflammatory microglial subtype near the well-known APOE risk region. These patterns point to distinct microglial states as key players in how certain genetic variants drive Alzheimer’s risk.

What this means for future therapies
To a non-specialist, the main message is that where a gene acts can be as important as what the gene does. By moving TWAS from blended tissues down to precise cell types and subtypes, and by carefully modeling the quirks of single-cell measurements, scTWAS uncovers gene–disease connections that were previously invisible. This sharper map helps researchers home in on the exact cell populations and pathways that should be targeted for new drugs or interventions, from blood formation and immunity to the brain’s immune cells in Alzheimer’s disease.
Citation: Lin, Z., Su, C. scTWAS: a powerful statistical framework for single-cell transcriptome-wide association studies. Nat Commun 17, 3853 (2026). https://doi.org/10.1038/s41467-026-70374-7
Keywords: single-cell genomics, genetic risk mapping, immune cells, Alzheimer’s disease, statistical genetics