Clear Sky Science · en
Residential segregation assessment based on multi-source data and random forest method: a case study of Nanjing
Why Where We Live Still Matters
Across cities, people with different incomes often end up living in separate neighborhoods. This invisible sorting shapes everything from school quality to access to parks and jobs. Yet tracking how this residential separation changes over time is surprisingly hard, because it usually depends on slow, expensive population surveys. This study focuses on Nanjing, a major city in China, and shows how modern digital maps and housing data can be combined to give a faster, more flexible picture of who lives where—and how mixed or divided the city has become.
From Households to Housing Compounds
Traditional studies of segregation rely on census data that count how many rich and poor people live in each area, then compute indices of separation and diversity. But censuses are infrequent and can quickly go out of date in fast-changing cities. Some researchers have tried to work around this using housing prices as a stand-in for income, reasoning that more expensive homes usually mean wealthier residents. Others mix housing prices with satellite images and points of interest such as schools, shops, and parks. These approaches help, but they often ignore a crucial fact: not every square of land is equally populated. An empty industrial tract can look just as "poor" on a map as a crowded low-income neighborhood, even though almost nobody lives there.
Seeing Neighborhoods Through Residential Compounds
In Chinese cities, most urban residents live in clearly bounded residential compounds—groups of apartment buildings with shared gates, gardens, and services. Within a given compound, residents tend to have similar incomes and lifestyles, because the buildings’ quality, age, and surroundings "filter" who can or wants to live there. This study treats each compound as a basic unit of analysis. The authors argue that if you can reliably sort compounds into high-end, mid-range, and low-end categories, you can also infer the likely income levels of the people who live inside them, without needing detailed personal data.
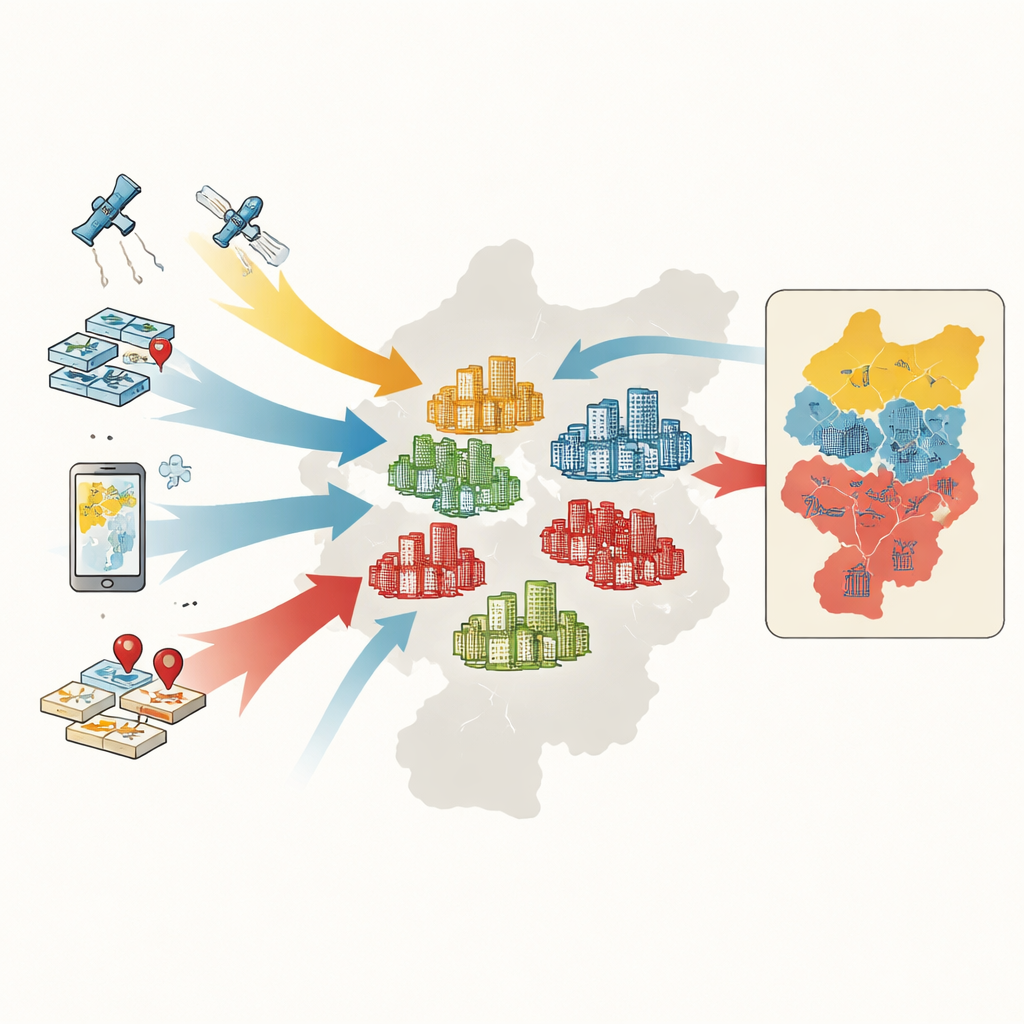
Turning Big Data Into a Citywide Map
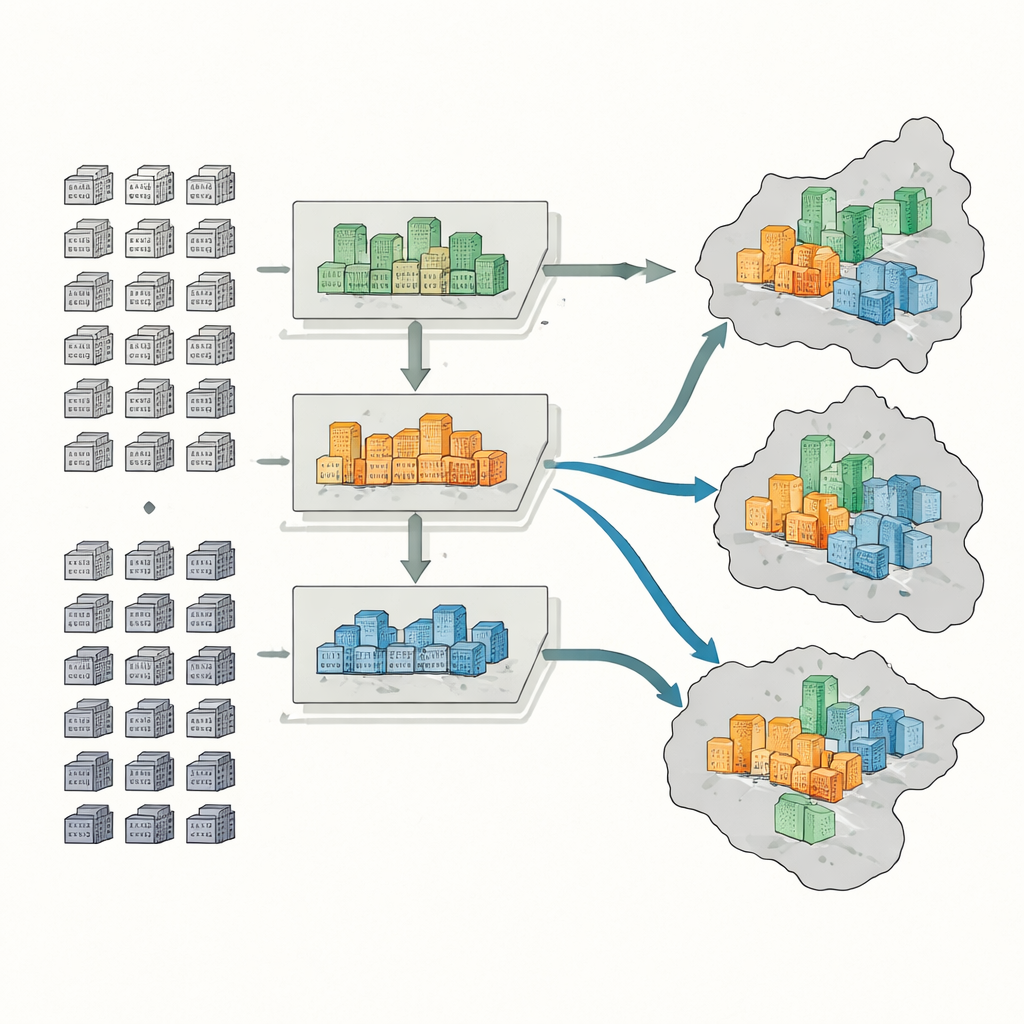
To classify compounds, the researchers assemble five kinds of information: official maps and boundaries, records of housing transactions, digital outlines of compound footprints from online maps, satellite-based measures of greenery, and thousands of points marking services like supermarkets, parks, and public transport stops. For each compound, they measure six key features: average selling price, building age, structural type, greenness, access to buses and metro, and density of everyday services. A machine-learning method called a random forest then learns patterns in these features and sorts more than 4,400 compounds into high-end, mid-range, or low-end groups.
Measuring Who Lives Where
Next, the team estimates how many people live in each compound using the number of housing units and typical vacancy rates, which differ by compound type. High-end buildings, for example, tend to have more empty homes than old, low-end blocks in the city center. They then map high-, mid-, and low-end populations across two scales: districts and smaller sub-districts. With this, they compute three standard indicators: a dissimilarity index that shows how sharply affluent and less affluent groups are separated; a location quotient that reveals where wealthy or low-income residents are unusually concentrated; and a diversity index that captures how evenly different income groups share the same areas.
What the Patterns in Nanjing Reveal
The results show that, overall, Nanjing’s main urban area has only a modest level of income-based separation. Yet certain districts stand out. Jianye, a heavily redeveloped area, has many new high-end compounds and relatively few low-end ones, leading to strong concentration of affluent residents and high segregation scores. Qinhuai, by contrast, contains many older, low-end compounds and fewer luxury developments, so it concentrates lower-income residents. Other districts such as Gulou and Qixia show more mixed patterns, with old and new housing side by side. At the finer sub-district scale, some places emerge as very mixed, while others are dominated by one income group. These patterns match independent checks using census counts and rental prices, suggesting that the method is capturing real social divides.
Why This New Lens Matters
For non-specialists, the key takeaway is that we can now track residential segregation without waiting years for a new census. By using residential compounds as "containers" for social groups and feeding multi-source data into a learning algorithm, the authors deliver a workable shortcut: they can estimate where different income groups live, how separated they are, and how that varies across a city. Their case study in Nanjing shows that this approach is both accurate and practical. As more cities generate rich digital traces—satellite images, online maps, property listings—this method offers planners and policymakers a new tool to monitor inequality, target investments, and test whether urban renewal projects are bringing people together or pushing them further apart.
Citation: Zhang, Y., Sun, Y., Zhu, AX. et al. Residential segregation assessment based on multi-source data and random forest method: a case study of Nanjing. Humanit Soc Sci Commun 13, 482 (2026). https://doi.org/10.1057/s41599-026-06840-w
Keywords: urban segregation, residential compounds, Nanjing, geospatial data, housing inequality