Clear Sky Science · en
Toward urban sustainability: assessing SDG11.2 via functional zone analysis in five Chinese cities
Why city streets and bus stops matter to daily life
As more people move into cities, a simple question becomes crucial: can everyday residents easily reach buses, subways, and trains? This paper looks at that question for five fast-growing cities in China’s Yangtze River Delta. By combining sharp satellite images with advanced computer analysis, the authors show how access to public transport differs from neighborhood to neighborhood, and what that means for building fairer, more sustainable cities.
Looking at cities block by block
Most global scorecards for sustainable development rate entire cities or regions with a single number. That is useful for comparison, but it hides big differences inside each city. A rich downtown district and an outlying informal settlement may share the same city score while offering totally different daily realities. To overcome this, the authors focus on “urban functional zones” – essentially city parcels bounded by roads that share a main use, such as housing, shops, factories, parks, or farmland. Studying these zones allows planners to see, for example, whether homes, schools, or factories have good access to public transport, instead of averaging everything together.
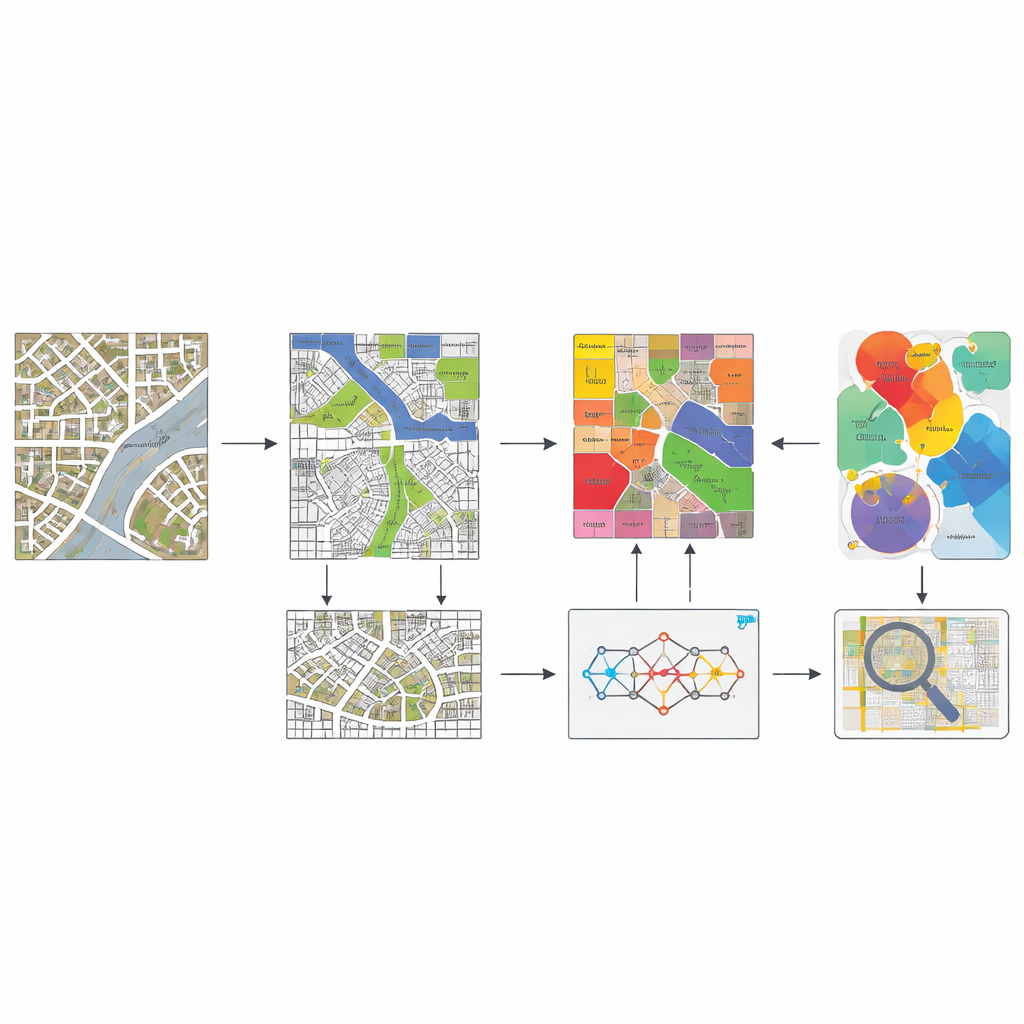
Seeing city structure from space
To map these functional zones across Shanghai, Suzhou, Hangzhou, Nanjing, and Hefei, the team built a new computer framework called E‑UFZ. It works a bit like a highly trained eye looking at detailed satellite pictures. First, the images are split into many small, coherent pieces that respect the road network, so blocks do not cross major streets. Then, a deep learning model analyzes patterns of roofs, vegetation, building shapes, and textures to recognize different types of areas: regular apartments, high-end villas, slums or informal settlements, commercial districts, campuses and offices, factories and warehouses, green open spaces, and farmland. Finally, a statistical step smooths and corrects the initial guesses so that neighboring pieces that look and behave alike are classified consistently.
Measuring who can actually reach a bus or train
Once the city has been divided into these functional zones, the authors overlay population data, road networks, and locations of bus stops, metro stations, and major transport hubs. For each zone, they estimate how many people live within a reasonable walking distance along real streets – 500 meters for ordinary stops and 1,000 meters for big terminals. This produces a simple indicator for every zone: the share of residents who can conveniently reach public transport. Values are then put on a common 0–1 scale so they can be fairly compared within and between cities, and mapped to reveal patterns of high and low accessibility.
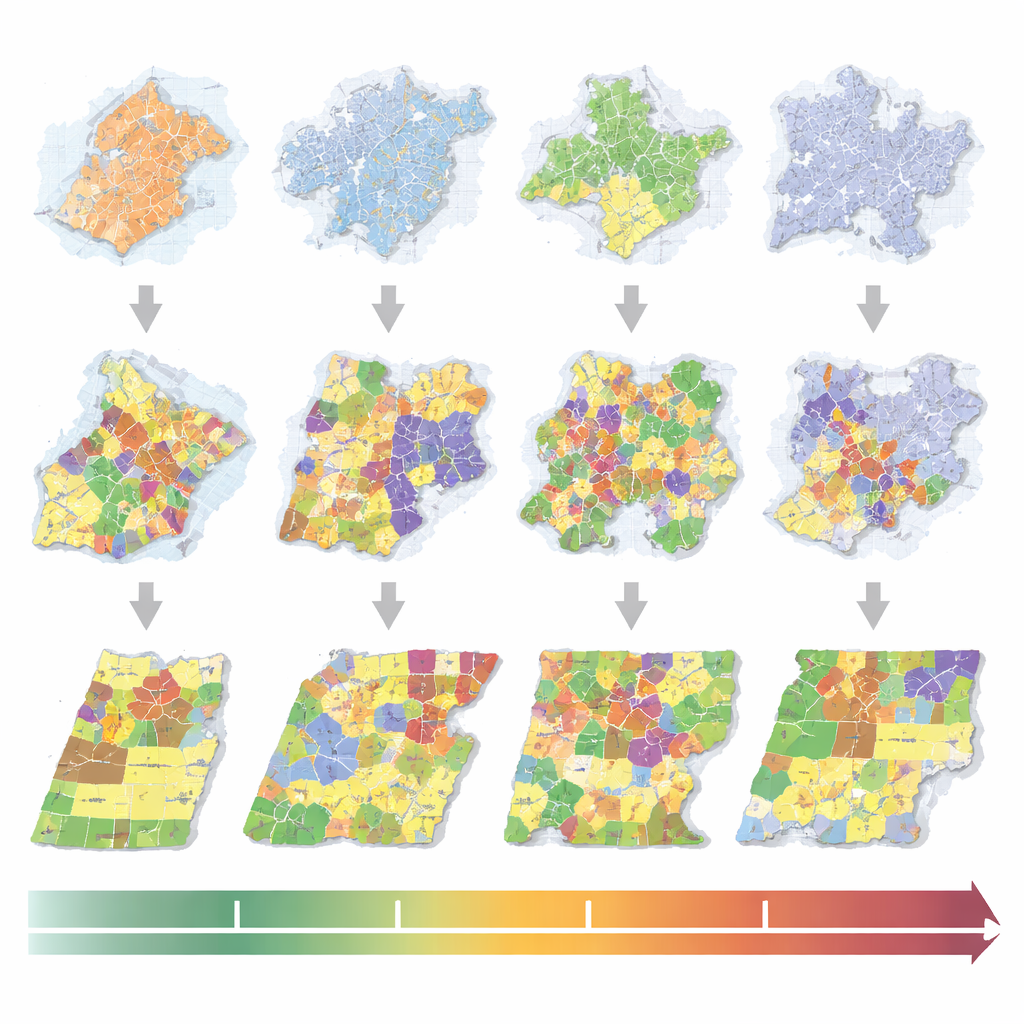
Uneven access across neighborhoods
The resulting maps reveal strong contrasts both within and across the five cities. In general, central areas packed with homes, offices, and public institutions enjoy high or very high access to public transport. Many residents in these zones can easily walk to a bus or metro. By contrast, outer fringe areas dominated by farmland, open space, or informal settlements often show very low access. In several cities, slum zones in particular stand out as being poorly served, even when they sit inside otherwise well-connected urban regions. The authors also find clear clusters of high-access and low-access zones, meaning that neighboring districts tend to share similar levels of service rather than being randomly mixed.
What this means for fair and sustainable cities
To a layperson, the study’s main message is that how we divide up and observe a city changes what we see about its fairness and sustainability. By looking at functional zones instead of whole cities, the authors show that many residents live in “blind spots” of the transport network, especially in poorer or more peripheral areas. At the same time, they demonstrate that modern mapping tools can reliably pick out different kinds of neighborhoods from satellite images and link them to real-world services like buses and trains. This approach can help city officials target investments where they are most needed, compare progress across cities, and, in the long run, extend similar fine-grained checks to other goals such as land-use efficiency or green space access.
Citation: Yuan, L., Zhang, X., Song, Z. et al. Toward urban sustainability: assessing SDG11.2 via functional zone analysis in five Chinese cities. npj Urban Sustain 6, 60 (2026). https://doi.org/10.1038/s42949-026-00367-4
Keywords: urban public transport, satellite mapping, sustainable cities, China urbanization, neighborhood accessibility