Clear Sky Science · en
Unsupervised risk factor identification across cancer types and data modalities via explainable artificial intelligence
Why finding hidden risk patterns matters
Cancer doctors know that people with the same diagnosis can have very different futures. Some respond well to treatment and live for many years, while others do not, even when their disease looks similar on paper. This article presents a new way to let computers search through routine medical data and scans to uncover hidden groups of patients who share similar chances of survival. By turning this into clear risk groups, the work aims to support more tailored treatment decisions without demanding complex extra tests.
A new way to group patients by outcome
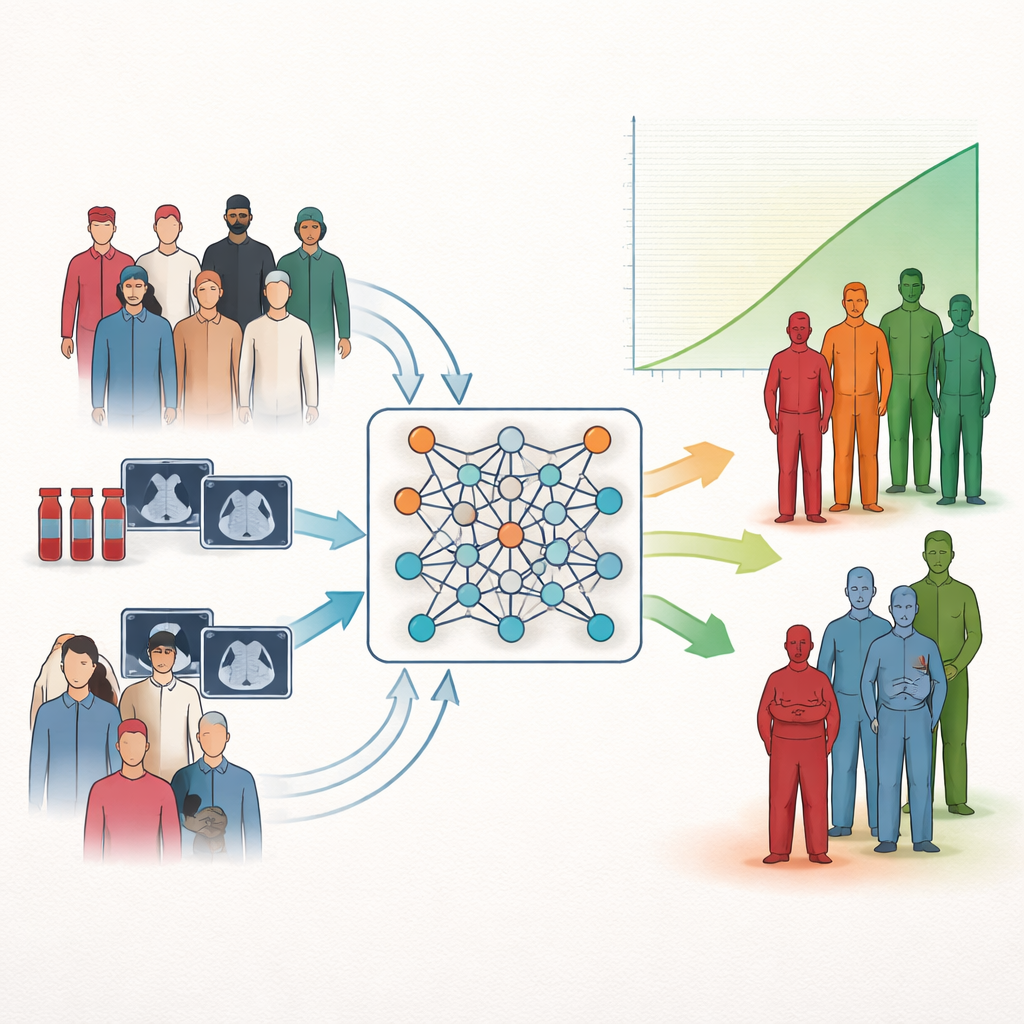
The researchers focus on a common task in medicine: risk stratification, which means sorting patients into groups with better or worse outlooks. Traditional statistical tools can estimate how individual measurements relate to survival, but they often do not map neatly onto simple low, medium, or high risk categories that clinicians can use at the bedside. Many modern artificial intelligence systems add power but still struggle to deliver clear, easy-to-interpret groupings. The authors tackle this gap by directly teaching neural networks to form patient clusters that differ as much as possible in survival, instead of only trying to predict survival time itself or clustering patients by surface similarity.
Letting survival data guide the learning
At the heart of the method is a reworking of a classic survival statistic, known as the logrank test, into a smooth objective that a neural network can optimize. Instead of placing each patient firmly into one group during training, the model treats group membership as probabilities and adjusts them to sharpen survival differences between clusters. A balancing term prevents the trivial solution where nearly all patients land in the same category. Because this training recipe acts only as a loss function, it can be plugged into many kinds of neural networks and many types of input data without changing their internal design.
What the method learned from blood tests
To show clinical value, the team first applied their approach to nearly one thousand people with multiple myeloma, a blood cancer, using only ten standard blood measurements taken around diagnosis. Their network automatically formed three risk groups whose survival curves were clearly separated. The poorest group had a median survival of about four years, while roughly seventy percent of the best group were still alive nine years later. When the authors used explainability tools to see which lab values drove these groupings, well-known markers of disease burden and kidney strain, such as beta-2-microglobulin and creatinine, pushed patients toward higher risk, while healthier levels of albumin and hemoglobin pulled them toward lower risk. The same patterns held in an independent clinical trial dataset, suggesting that the discovered groupings are robust.
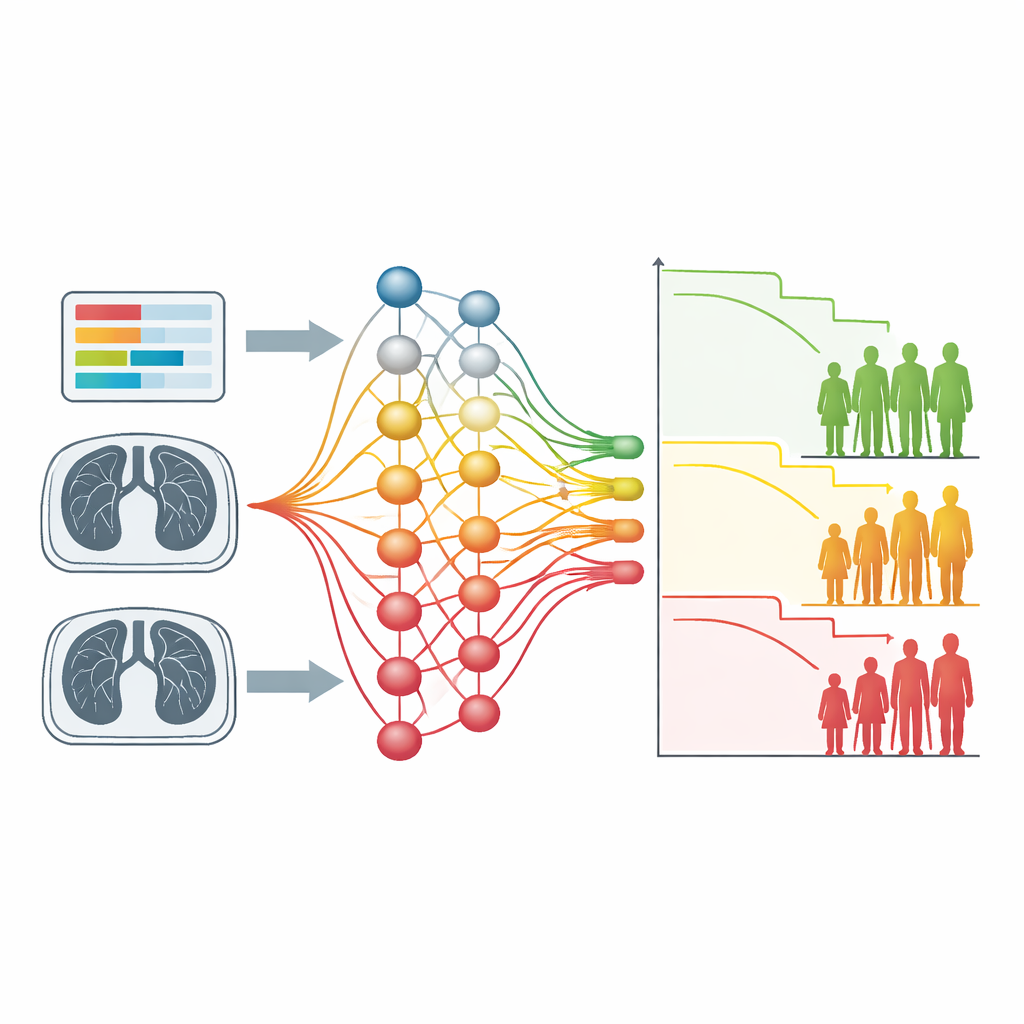
What the method found in lung scans
The second test case used chest CT scans from hundreds of people with non-small cell lung cancer. Here the input was imaging alone, without any hand-drawn tumor outlines or precomputed features. A convolutional neural network trained with the new loss function split patients into two groups with clearly different survival times, similar to more labor-intensive radiomics approaches. Visual explanation maps revealed that the model had learned to focus on lung regions containing tumors and their branching, infiltrating extensions, as well as nearby structures such as heart vessels. In high-risk patients these structures tended to contribute strongly to the model’s decisions, echoing clinical knowledge that infiltrative growth and heart disease are linked to poorer outcomes.
How this could shape future cancer care
Overall, the study shows that survival-guided clustering can rediscover known risk factors from both simple blood tests and complex scans, and can do so without manual labeling or handcrafted rules. Because the same training recipe works across cancers and data types, it offers a flexible starting point for exploring new prognostic patterns, including in areas like gene activity profiles or time-varying treatment data. For patients, the long-term promise is clearer risk categories that arise directly from their own data and that help clinicians match the intensity and style of therapy to the level of risk, while researchers gain a tool for spotting new signals linked to outcome.
Citation: Ferle, M., Ader, J., Wiemers, T. et al. Unsupervised risk factor identification across cancer types and data modalities via explainable artificial intelligence. npj Digit. Med. 9, 363 (2026). https://doi.org/10.1038/s41746-026-02663-w
Keywords: cancer risk stratification, survival analysis, medical imaging AI, multiple myeloma, lung cancer