Clear Sky Science · en
Macroscopic polarimetric discrimination and quantification of antiangiogenic effect of AGRO aptamer and GK1 peptide in a preclinical melanoma model
Seeing Cancer Tissue in a New Light
Cancer doctors and pathologists still rely heavily on looking at thin slices of tissue under the microscope to decide how a tumor is behaving and whether a treatment is working. But this visual inspection is slow, covers only tiny areas, and can be somewhat subjective. This study introduces a light-based imaging method that can scan large pieces of melanoma tumor tissue at once and automatically distinguish blood-vessel–rich regions from areas packed with tumor cells, offering a more objective way to track how new anticancer treatments reshape the tumor’s inner landscape.
Why Blood Vessels Matter in Melanoma
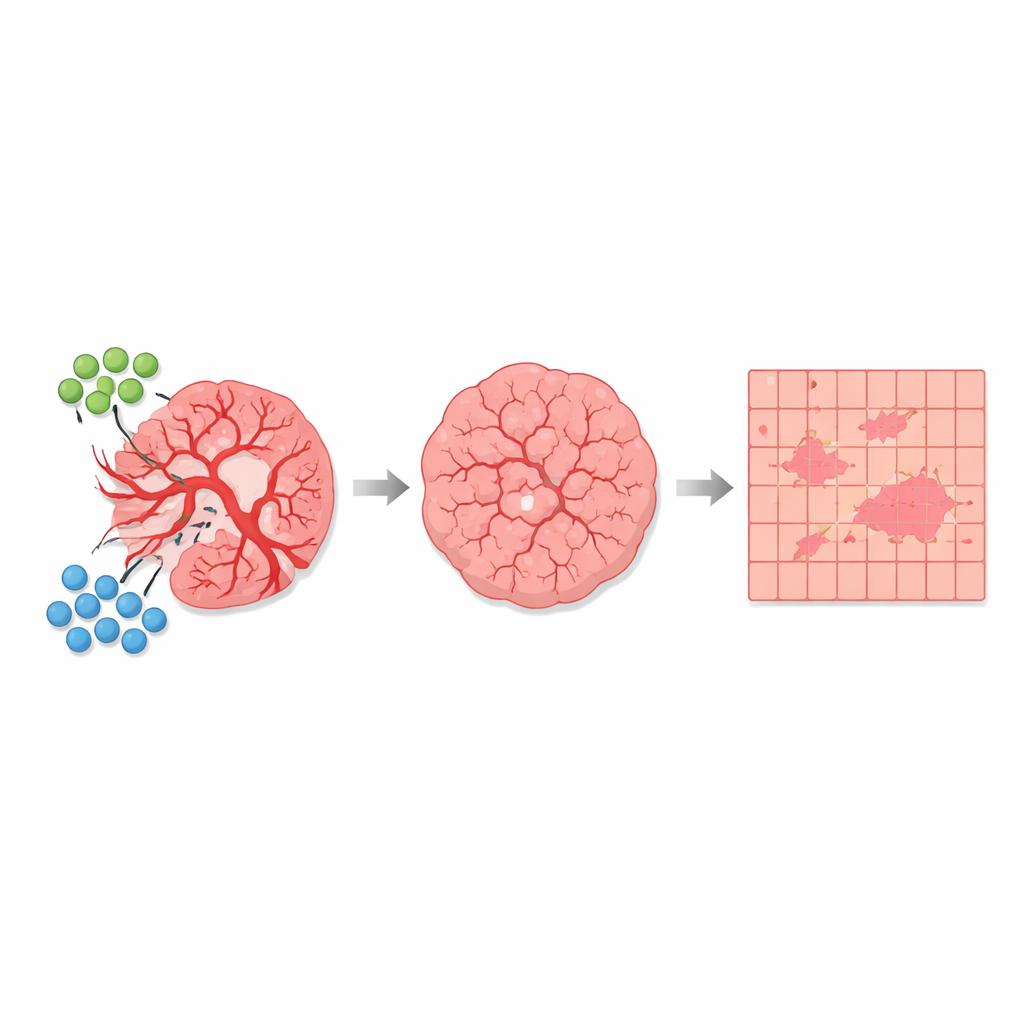
Melanoma, the most dangerous form of skin cancer, often becomes life-threatening when it grows aggressively and spreads through the body. To do that, tumors build their own network of blood vessels, a process known as angiogenesis. These vessels feed the tumor with oxygen and nutrients and provide escape routes for cancer cells to reach distant organs. Because of this, drugs that cut off or remodel tumor blood vessels—called antiangiogenic therapies—are a major focus of cancer research. In this work, the authors studied a mouse model of melanoma treated with a combination of two experimental agents, an aptamer called AGRO and a peptide named GK1, both designed to disrupt the blood supply and weaken the tumor.
Turning Polarized Light into a Tissue Map
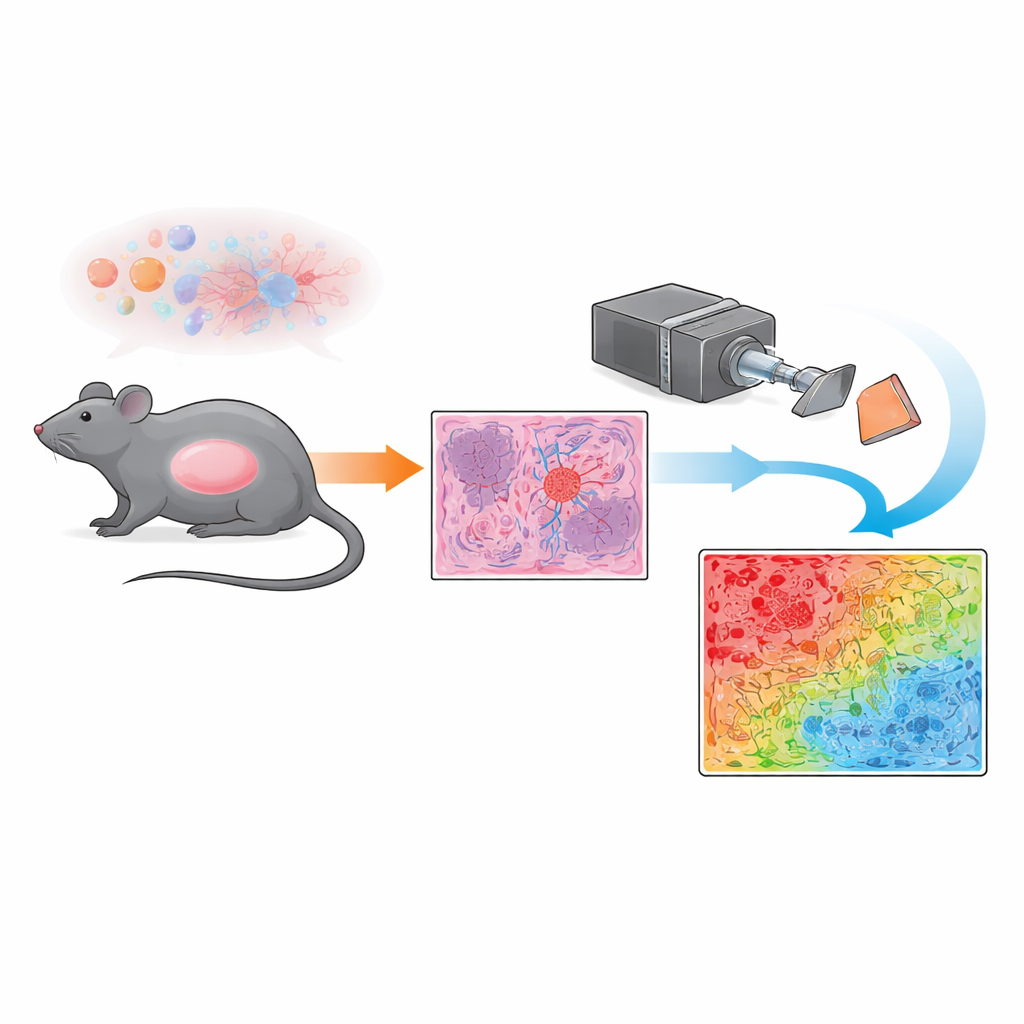
Instead of relying solely on conventional microscopy, the team used a technique called Mueller polarimetric imaging. In simple terms, they shine polarized light—light waves vibrating in a preferred direction—onto stained tumor slices and record how the tissue scrambles or preserves that polarization. Different structures inside the tumor, such as dense, disordered blood vessels or more uniform clusters of tumor cells, disturb the light in distinct ways. By measuring these changes at each tiny point across a large field of view, the system produces a “depolarization index” map, a kind of optical fingerprint that reflects how ordered or disordered the microscopic structure is at each pixel.
Color-Coding Blood Vessels and Tumor Cells
To turn these optical fingerprints into something a pathologist could interpret at a glance, the researchers developed a simple pixel-by-pixel classification scheme. They first compared the polarimetric maps with high-magnification microscope images reviewed by an expert pathologist, focusing on well-defined regions dominated either by tumor cells or by irregular blood vessels. Blood-vessel–rich zones showed strong depolarization (high scrambling of the light), while tumor cell–dominated areas showed weaker depolarization (more orderly passage of light). Using threshold values derived from these reference regions, the team assigned each pixel to one of several categories—strongly depolarizing, weakly depolarizing, transitional, or background—and displayed them as a color-coded mask over entire sections. This approach allowed them to quantify, in square millimeters, how much of each tumor slice was made up of vessel-dominated tissue versus tumor-cell–dominated tissue and mixed areas.
Tracking Treatment Impact Across the Whole Tumor
With this automatic segmentation in place, the authors compared many tissue sections from untreated mice and from mice treated with the AGRO plus GK1 combination. Across more than 1,700 square millimeters of analyzed tissue, they found that strongly depolarizing regions associated with blood vessels occupied only about 1 percent of the total area overall—but their proportion clearly differed between groups. In untreated tumors, blood-vessel–dominated tissue and nearby mixed zones took up a larger fraction of the tumor slice. In treated tumors, these high-depolarization and transitional regions shrank, while weakly depolarizing regions, mainly composed of tumor cells, became relatively more abundant. Importantly, the basic optical “signature” of each tissue type stayed the same; what changed with therapy was how much of the tumor belonged to each category, consistent with an antiangiogenic effect that prunes vessels and alters the tumor microenvironment.
What This Means for Future Cancer Care
For non-specialists, the key message is that this polarimetric imaging method offers a wide-angle, quantitative view of tumor architecture that standard microscopes do not easily provide. By objectively counting how much of a tumor slice is occupied by blood vessels versus tumor cells, and doing so over areas tens of times larger than a typical microscope field, the technique can sensitively detect whether an antiangiogenic treatment is reducing the tumor’s blood supply. While the work was done in a preclinical mouse model of melanoma, it points toward future tools that could help researchers and, eventually, clinicians evaluate new cancer therapies more rapidly and consistently, complementing—but not replacing—the trained eye of the pathologist.
Citation: Montes-Gonzalez, I., Bisbal-Amat, J., Perez-Torres, A. et al. Macroscopic polarimetric discrimination and quantification of antiangiogenic effect of AGRO aptamer and GK1 peptide in a preclinical melanoma model. Sci Rep 16, 14299 (2026). https://doi.org/10.1038/s41598-026-44959-7
Keywords: melanoma, tumor microenvironment, polarimetric imaging, angiogenesis, cancer therapy