Clear Sky Science · en
Enhancing survival risk prediction through imputation and feature selection in high-dimensional protein biomarker data
Why this matters for patients
Doctors increasingly want to use blood tests to forecast how a person’s cancer is likely to behave—whether it will come back or spread—and to tailor treatment accordingly. Modern protein tests can measure hundreds of molecules at once, but the resulting data are messy, full of missing values, and involve far more measurements than patients. This paper shows how to carefully clean and analyze such complex data so that survival predictions are more reliable and easier for clinicians to interpret.
Turning messy lab results into useful signals
The authors focus on protein biomarkers, molecules in the blood whose levels can hint at how a tumor is growing, how the immune system is responding, and how a patient is reacting to therapy. In real-world studies, these markers are measured repeatedly over time, but some readings are often missing because of technical issues or patient dropouts. Simply throwing away incomplete records or filling gaps with crude averages can badly distort results, especially when hundreds of proteins are tracked in a small group of patients. The study therefore builds a step-by-step analysis pipeline designed to keep as much information as possible while avoiding misleading shortcuts.
Filling in the gaps without peeking at outcomes
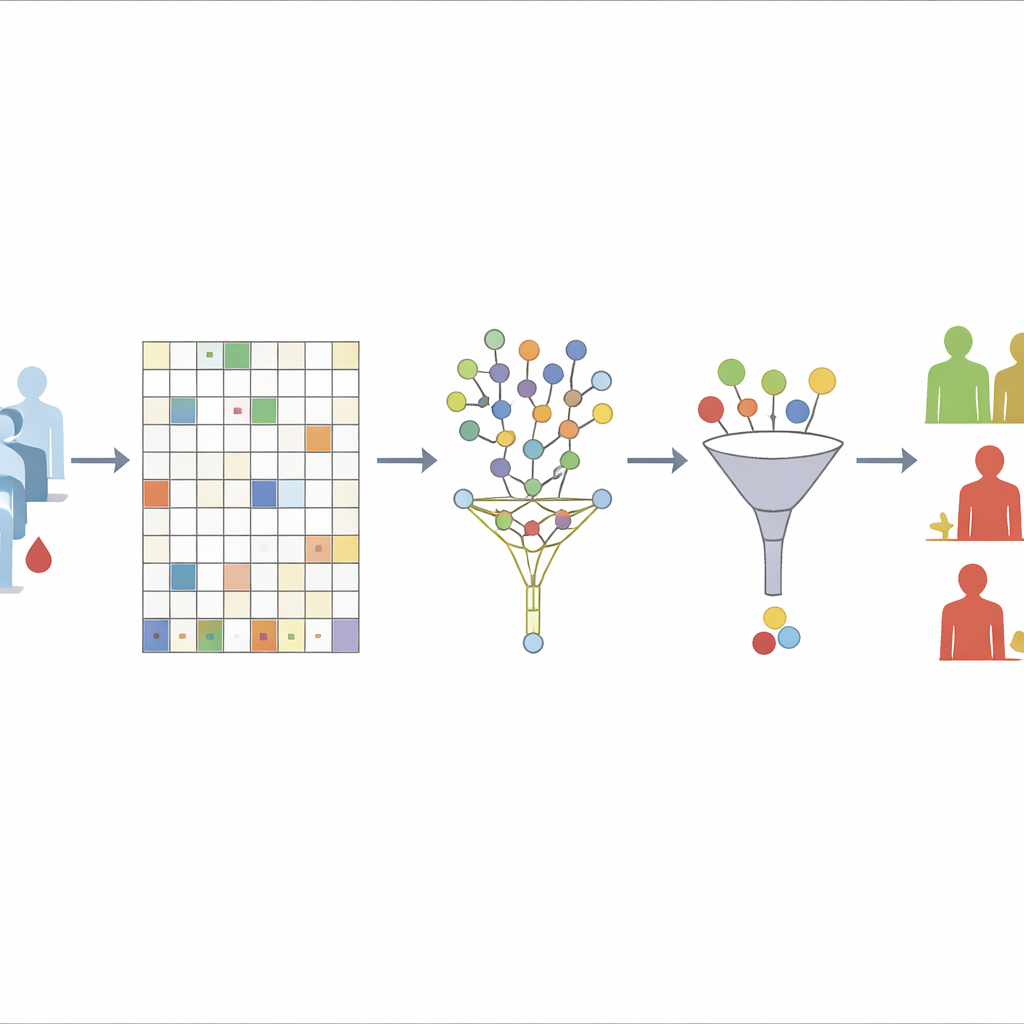
The first challenge the team tackles is missing data. They begin by discarding only those proteins that are missing in more than 30% of patients, a level they show is a good balance between stability and information loss. For the remaining proteins, they use an “unsupervised” random forest approach to guess the missing values. In essence, the algorithm repeatedly builds many decision trees based only on how proteins relate to each other, not on who relapsed or developed metastases. Samples that tend to look similar across many trees are treated as neighbors; the known values in these neighbors are then used to fill in the gaps. By deliberately excluding survival outcomes from this step, the authors avoid accidentally baking the answer into the data-cleaning process.
Narrowing hundreds of markers down to a meaningful few
Once the protein table is complete, the next step is to decide which markers really matter for predicting time until relapse or metastasis. The authors first use a technique that shrinks weak predictors toward zero while keeping stronger ones, effectively acting like a sieve that lets only the most informative proteins through. Because this method can miss groups of correlated markers or subtle non-linear patterns, they then re-examine the survivors with a second tool based on many randomized decision trees built for survival data. This second stage does not re-fit the same regression but instead scores how often each marker helps the trees split patients with different outcomes. Markers that consistently appear near the top of the trees are considered more stable and important.
From selected markers to patient-level risk groups
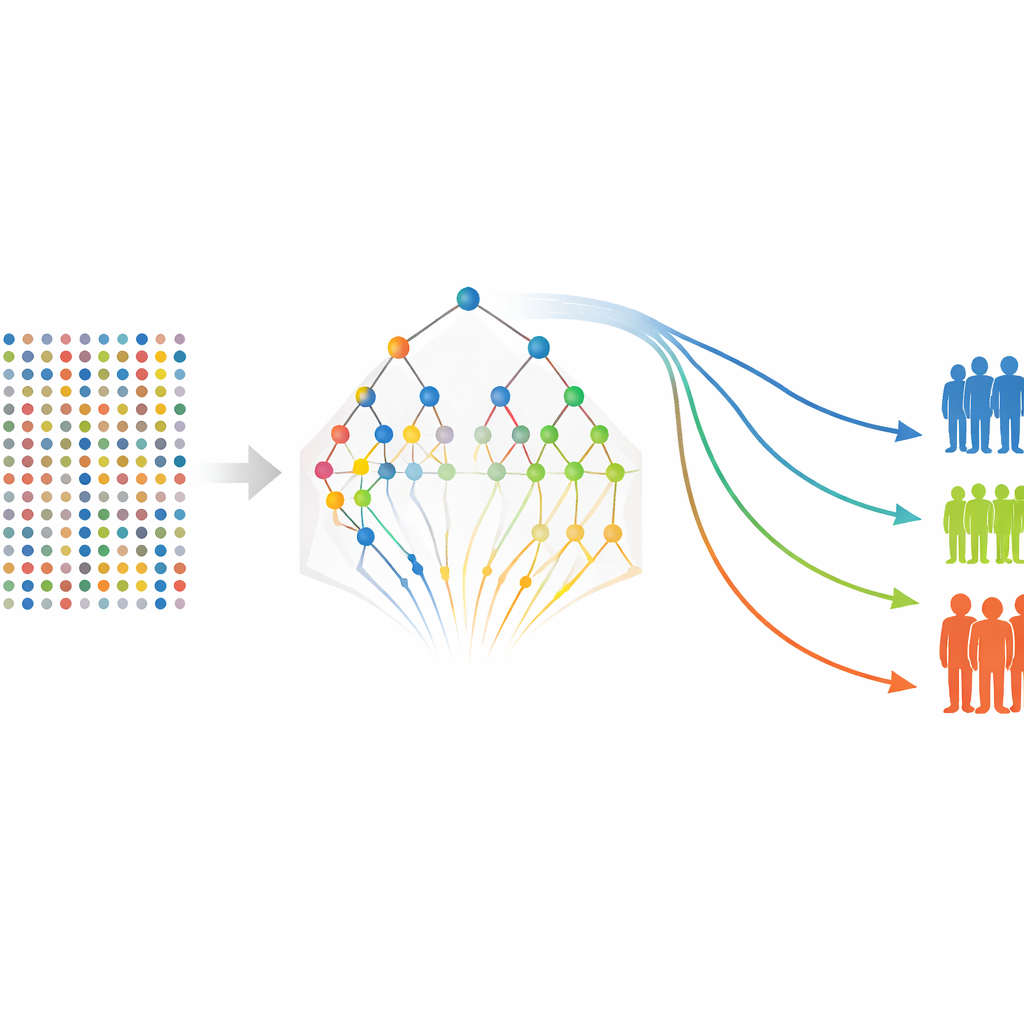
With a refined list of proteins in hand, the authors return to more traditional survival models to estimate how each marker—and some clinical features such as tumor stage—relates to the chances of remaining free of relapse or distant spread. They build models separately for relapse-free survival and metastasis-free survival, then compute a risk score for each patient based on their protein levels and clinical characteristics. Patients are grouped into low-, medium-, and high-risk categories, and standard survival curves show clear separation between these groups, even though the study includes only 80 patients. Several proteins, including FGF-5, Neuropilin-2, and Siglec-5–related measures, repeatedly emerge as strong indicators of worse outcomes, while some markers appear to be protective.
Testing the pipeline under tough conditions
To check that their approach is not just overfitting this small dataset, the researchers run extensive computer simulations that mimic high-dimensional protein studies with strong violations of common modeling assumptions and different patterns of missing data. In these stress tests, the same pipeline still identifies a compact set of truly important markers and separates low- and high-risk groups, even when the usual assumptions behind classic survival models do not hold. They also vary the missing-data thresholds and show that the key markers and overall conclusions remain largely stable.
What this means going forward
Rather than inventing a brand-new statistical trick, this work assembles and validates a practical recipe for turning complex protein measurements into clinically meaningful risk predictions. By carefully handling missing values, narrowing the focus to a stable set of biomarkers, and checking performance with robust internal validation and simulations, the pipeline offers a transparent way to identify promising markers and build risk scores in small, data-rich cancer studies. The authors stress that larger, independent cohorts are still needed to confirm specific proteins as routine clinical tests, but their framework provides a solid, reusable blueprint for future biomarker-driven survival research.
Citation: Kumar, N., Bhattacharjee, A., Vishwakarma, G.K. et al. Enhancing survival risk prediction through imputation and feature selection in high-dimensional protein biomarker data. Sci Rep 16, 14490 (2026). https://doi.org/10.1038/s41598-026-43072-z
Keywords: cancer biomarkers, survival prediction, proteomics, missing data, precision medicine