Clear Sky Science · en
Sustainable regional corn yield prediction for the United States through interpretable machine learning approach
Why predicting corn harvests matters
Corn sits at the heart of America’s food system, feeding people, livestock, and even fueling cars. But each year, farmers and policymakers must make big decisions—how much to plant, what to store, how to price grain—without knowing exactly how much corn will be harvested. As weather grows more unpredictable and markets more volatile, the ability to forecast regional corn yields accurately and sustainably becomes crucial for food security, farm profits, and a stable supply chain.
From simple guesses to smarter forecasts
For decades, experts relied on relatively simple statistical tools to predict crop yields, using past harvests, basic weather data, and some information about soils. These methods captured broad trends but struggled with today’s reality: enormous volumes of data and complex, non-linear relationships between climate, soil health, management practices, and plant growth. The new study steps into this gap by building more powerful yet interpretable machine learning models that can handle rich, multi-source data while still offering insights that farmers, traders, and policymakers can understand and trust.
Bringing many data streams together
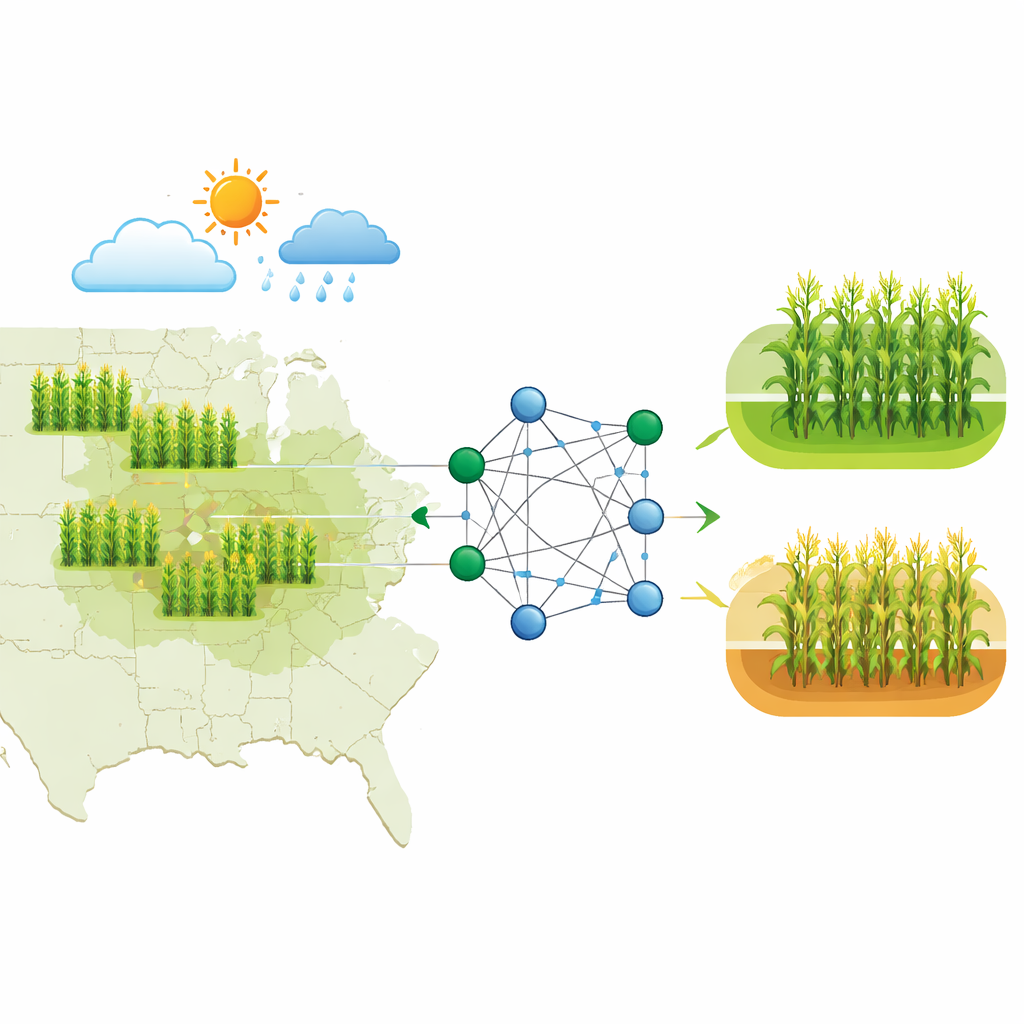
The researchers focus on county-level corn yield across the U.S. Corn Belt, where reliable data and large planted areas make regional forecasts especially valuable. They assemble a comprehensive dataset covering 2010–2020 that blends several types of information: detailed weather records such as rainfall, temperature, humidity, and drought indicators; soil properties like type, moisture, and nutrient levels; satellite-based vegetation indices that track how healthy and green cornfields are over time; and historical county yields from federal statistics. They also add corn futures price data as a supplemental signal of market conditions, while keeping the prediction target strictly agricultural: whether a county’s yield will be above or below its own historical median in a given year.
How the smart model makes its call
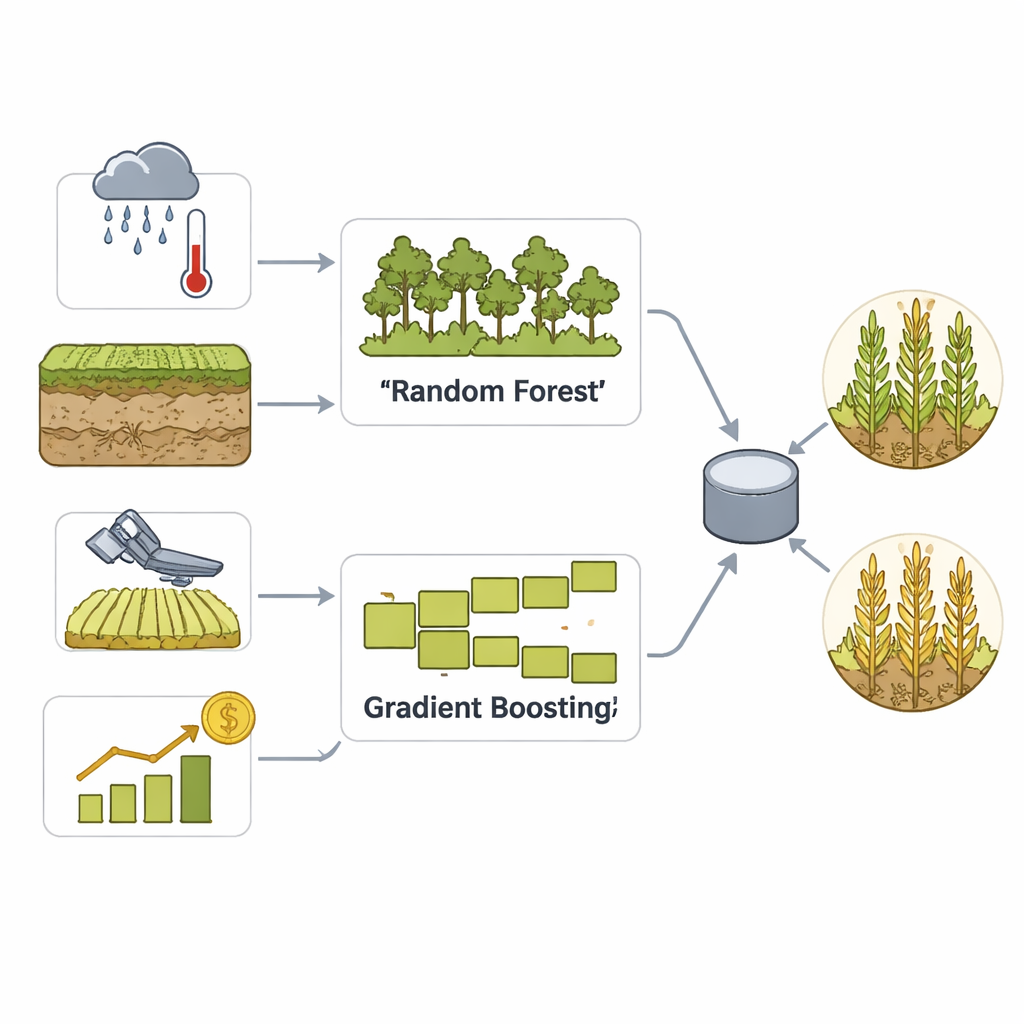
To turn this rich data into practical forecasts, the team builds an ensemble model that combines two well-established machine learning approaches: Random Forest and Gradient Boosting. Both are good at finding subtle patterns in many variables, but they work in different ways—one by averaging many decision trees, the other by gradually correcting its own errors. A voting step then blends their strengths into a single decision about whether a county is likely to have a high or low yield. Careful data cleaning, scaling, and feature engineering help the model recognize seasonal patterns and extreme weather events, while extensive cross-validation keeps it from simply memorizing the past.
Seeing inside the black box
Advanced models often raise a concern: they can be accurate yet opaque. To address this, the authors use SHAP, a modern technique for explaining which inputs most strongly influence each prediction. SHAP assigns each feature a contribution score, showing, for example, how unusual rainfall patterns or vegetation signals push a forecast toward a high or low yield. In this study, temporal factors, measures of variability, and satellite-based plant health indicators emerge as key drivers. This transparency makes the model more than a mere predictor; it becomes a decision-support tool that can highlight why certain regions are at risk and where interventions—such as irrigation, insurance, or storage planning—might matter most.
What the results mean for the real world
The final model performs strongly, correctly classifying high- versus low-yield county years with about 92% precision, recall, and test accuracy, and 97% accuracy on training data, indicating both power and good generalization. Market data improves performance only slightly, suggesting that most predictive strength comes from agronomic and environmental factors rather than financial signals. While the approach is tailored to the U.S. Corn Belt and simplifies yield into a two-level outcome, it offers a scalable, energy-efficient way to turn complex data into actionable regional forecasts. For planners and supply chain managers, that means earlier and more reliable warnings about shortfalls or surpluses, supporting smarter decisions on planting, insurance, storage, and trade in a changing climate.
Citation: Kehkashan, T., Abdelhaq, M., Al-Shamayleh, A.S. et al. Sustainable regional corn yield prediction for the United States through interpretable machine learning approach. Sci Rep 16, 13942 (2026). https://doi.org/10.1038/s41598-026-43213-4
Keywords: corn yield prediction, machine learning in agriculture, remote sensing data, food security, climate and crops