Clear Sky Science · en
M $$\vphantom{0}^2$$ DGAT: Multi-view multi-scale dynamic graph attention network(GAT) based prediction of Parkinson’s disease(PD) progression using whole-blood RNA sequencing data
Why blood can help track brain disease
Parkinson’s disease is best known for its tremors and movement problems, but by the time these symptoms appear, years of hidden damage have already taken place in the brain. Doctors urgently need ways to forecast how quickly a person’s Parkinson’s will worsen so that treatments can be better timed and tailored. This study shows that a simple blood draw, when combined with an advanced artificial intelligence system, can reveal subtle molecular signals that predict both movement and thinking changes in people with Parkinson’s.
Reading the brain’s story from blood
Rather than scanning the brain directly, the researchers focused on whole-blood RNA sequencing, which measures which genes are turned up or down in blood cells. Although blood is far from the brain, earlier work has shown that immune activity and other body-wide processes mirror what is happening in the nervous system. The challenge is that these gene-activity readouts are extremely noisy: tens of thousands of genes fluctuate over time, and important disease signals can easily be drowned out. The team set out to build a model that could sift through this complexity and track how Parkinson’s unfolds in individual patients.
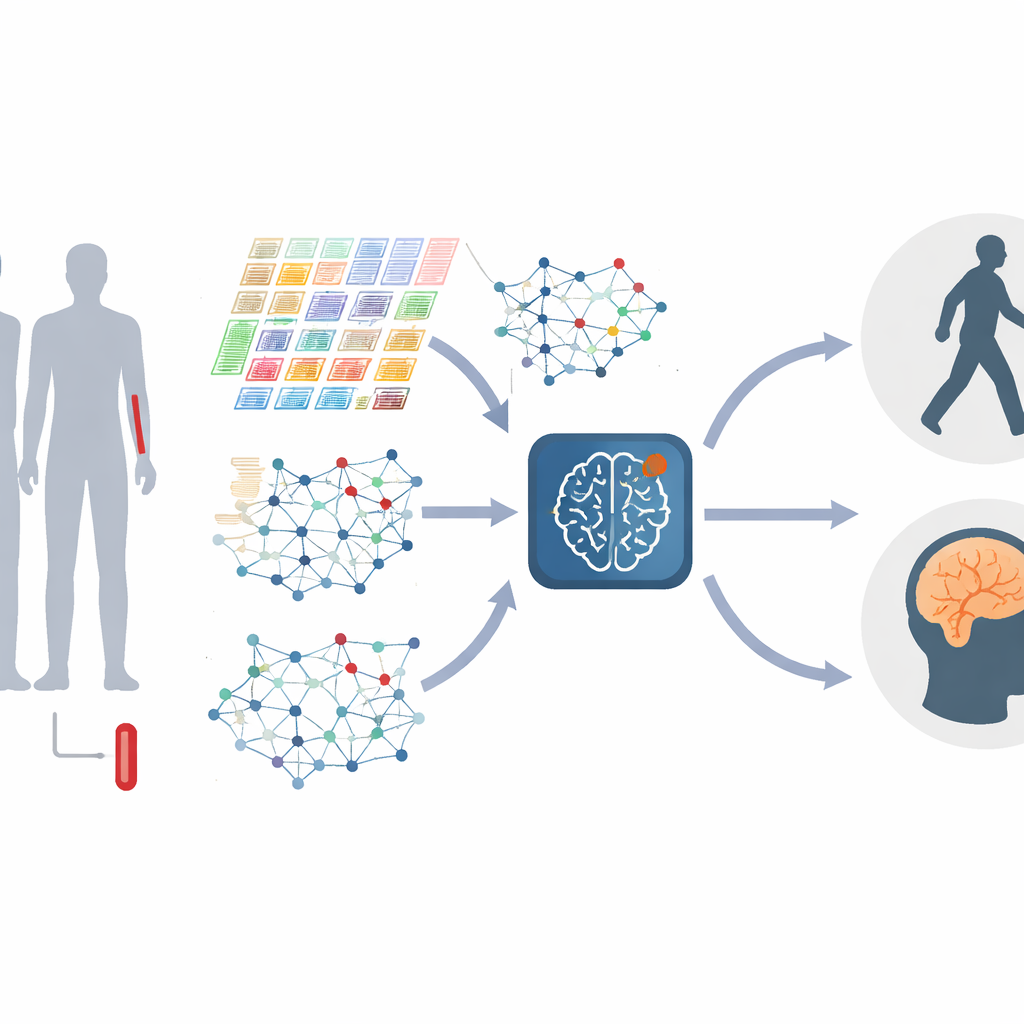
Turning genes into living networks
Instead of treating each gene separately, the authors represent genes as a network, where genes that behave similarly are linked together. These networks change as the disease progresses, with clusters of genes—often tied to immune responses, protein handling, or cell death—growing or shrinking in importance. The study builds these “gene graphs” at both a global level, capturing the overall structure, and a local level, focusing on tightly knit modules of related genes. By combining information across many scales, the model can detect fine-grained distortions in how genes interact, which may mark different stages or types of Parkinson’s.
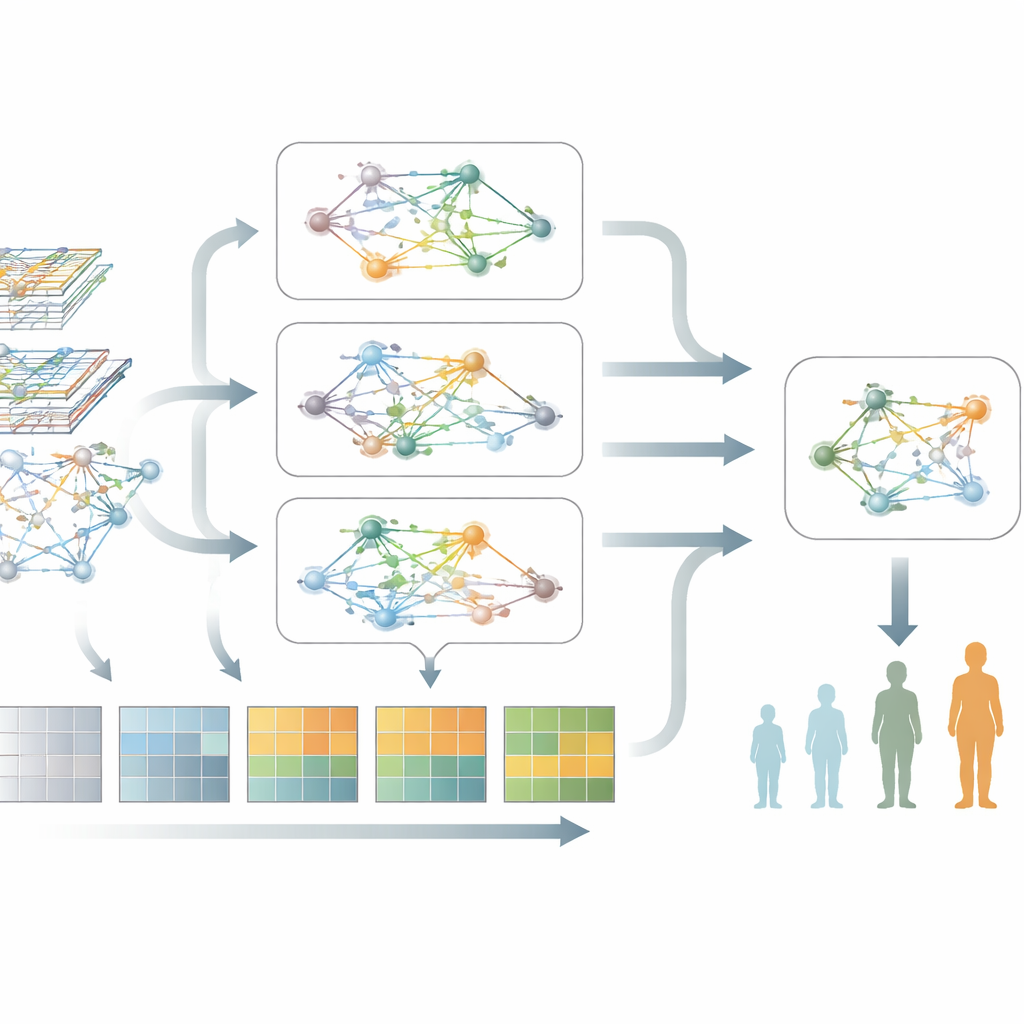
Following disease over time, not just in snapshots
Parkinson’s does not stand still, so the model also needs to understand change. To do this, the researchers feed in repeated blood samples from the same people at several clinic visits, turning each person’s data into a short film rather than a single photo. One part of their system focuses on how gene activity levels rise and fall over time, learning which temporal patterns matter most and filtering out random fluctuations. Another part focuses on how the gene networks themselves remodel as the disease advances. A specialized “dynamic graph attention” engine then learns which connections in these evolving networks best distinguish one disease stage from another.
Blending two views into a single picture
The heart of the new method, called M2DGAT, is that it combines these two views—temporal changes in gene activity and shifting gene-network structure—into one joint representation for each patient and time point. Instead of simply stacking the two types of data together, the model uses a clever mathematical trick to fuse them, capturing complex interactions between “when” and “how” genes misbehave. The resulting signatures are then linked to standard clinical measures: the Hoehn and Yahr scale for movement problems and the Montreal Cognitive Assessment for thinking and memory. Across two large Parkinson’s cohorts, this approach consistently outperformed several leading deep-learning methods at classifying disease stage and predicting cognitive scores.
What the model reveals about Parkinson’s biology
Beyond prediction, the model highlights groups of genes and pathways that are most strongly associated with worsening Parkinson’s. When the authors examined these genes, they found repeated signals pointing to disrupted protein production and handling, chronic immune activation, and pathways tied to programmed cell death and cellular stress. Strikingly, these biological themes appeared in two independent patient groups, suggesting that the model is capturing robust, disease-related biology rather than random patterns. This kind of network-level view helps connect blood markers back to the underlying processes damaging neurons.
From complex code to clearer forecasts
In plain terms, this work shows that it is possible to turn the bewildering complexity of blood gene activity into a compact, readable fingerprint of Parkinson’s progression. By looking simultaneously at how genes fluctuate over time and how they interact in shifting networks, the M2DGAT system can more accurately gauge both movement and cognitive decline than existing tools. While more validation is needed before it can guide care, the approach points toward a future where a routine blood test, interpreted through sophisticated network-based AI, could help doctors forecast the course of Parkinson’s and tailor treatments long before severe symptoms appear.
Citation: Wei, Z., Zeqi, X., Chenjun, W. et al. M\(\vphantom{0}^2\)DGAT: Multi-view multi-scale dynamic graph attention network(GAT) based prediction of Parkinson’s disease(PD) progression using whole-blood RNA sequencing data. Sci Rep 16, 11777 (2026). https://doi.org/10.1038/s41598-026-40636-x
Keywords: Parkinson’s disease, blood transcriptomics, graph neural networks, disease progression, precision medicine