Clear Sky Science · en
Construction of automatic air monitoring point siting model based on convolutional neural network and K-means clustering
Why Smarter Air Monitors Matter to City Life
City dwellers breathe air shaped by traffic, factories, and weather, yet most cities can afford only a small number of monitoring stations to keep watch. This paper presents a new way to decide exactly where those stations should go so that a limited set of sensors can still give a clear picture of pollution across an entire urban area. By combining modern pattern-recognition algorithms with clever clustering of similar places, the authors aim to map citywide air quality with high accuracy while keeping costs and computing time under control.
From Patchy Readings to a Full Picture
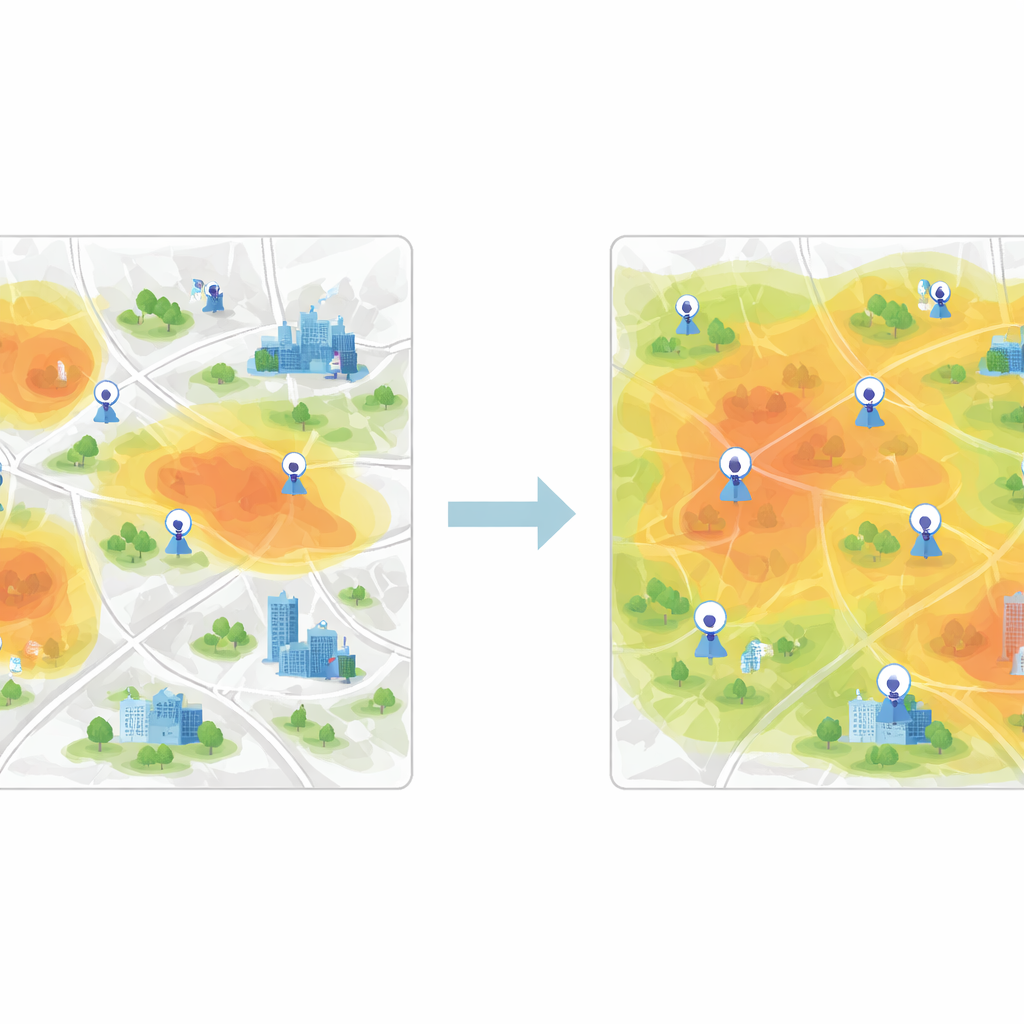
Traditional air monitoring networks leave large gaps between stations, so air quality in many neighborhoods is effectively unknown. At the same time, adding many more stations is too expensive and often impractical. The study focuses on the siting problem: given a city divided into small grid cells and a limited budget for sensors, which locations should be monitored so that the readings reflect pollution patterns everywhere, not just near existing sites? The authors argue that good choices must account for how pollution changes over both space and time and how it is shaped by weather, traffic, and land use, not just by averages at a few points.
Letting a Neural Network Learn the Patterns
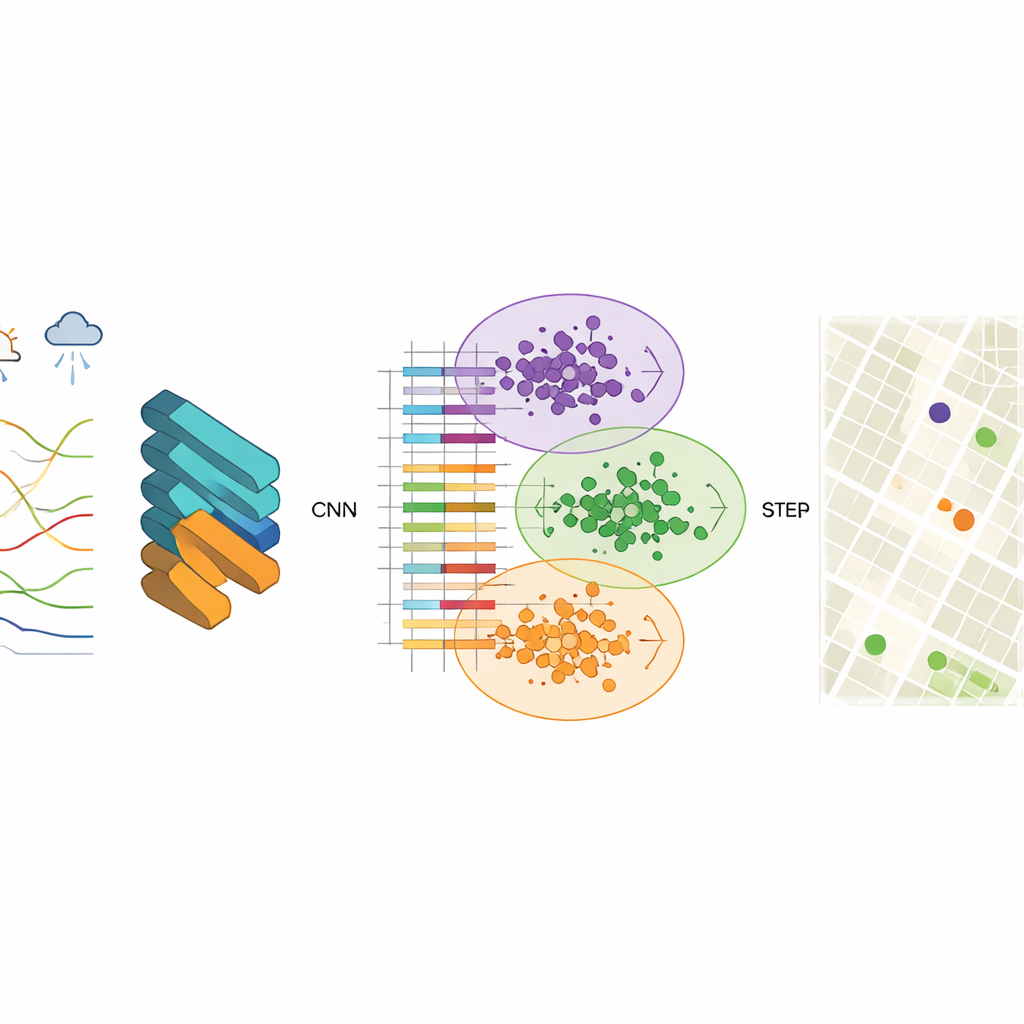
To uncover those patterns, the researchers use a convolutional neural network (CNN), a type of deep-learning model normally used for image recognition. Here, the “images” are structured air-quality records that include pollutant levels such as fine particles, coarse particles, ozone, and carbon monoxide, along with temperature, humidity, wind, and other factors. The CNN learns compact feature vectors—condensed numerical summaries—that capture how pollution behaves across space and time. The team finds that using 256 hidden nodes gives a good balance of accuracy and speed, producing stable outputs and very small prediction errors when reconstructing the observed data.
Grouping Similar Areas to Cover the City Fairly
Once these feature vectors are learned, the next step is to group grid cells with similar air-quality behavior. For this, the study uses K-means clustering, an algorithm that separates data into a preset number of clusters. When clustering is applied directly to raw measurements, the boundaries between groups are fuzzy and the algorithm converges slowly. After CNN-based feature extraction, however, clusters become much clearer, and the algorithm quickly finds stable centers that represent typical pollution patterns. Each cluster stands for a zone in the city where air behaves similarly, even if the neighborhoods inside it look very different on a map.
Choosing the Best New Spots with Information Gain
To decide which new sites to add, the authors introduce an information-entropy-based greedy procedure. They view the city as a network of nodes, some already labeled with real sensor data and others unlabeled. Using feature similarity between labeled and unlabeled nodes, they compute how uncertain each unlabeled node is in terms of its air-quality role. Nodes that are least like the existing ones—or that sit near boundaries between pollution regimes—have higher information value. Iteratively, the algorithm ranks nodes by this measure and “promotes” the most informative ones into the labeled set, retraining the model each time. The final recommended stations are those with the highest average priority across multiple time periods.
How Well Does It Work in Real Cities?
The model is tested on three Chinese cities with very different pollution levels: a heavily industrial city, a mixed-use city, and a cleaner tourist city, using more than 400,000 hourly records of pollutants and weather. Compared with two earlier siting approaches, the new method achieves a correlation of 0.96 between predicted and observed air-quality values, with mean errors under 1% and strong agreement for both primary pollutants like coarse particles and sulfur dioxide and secondary pollutants like ozone and nitrogen dioxide. It also processes data roughly twice as fast as competing methods, with sub-second average latency, and runs efficiently across city types, indicating that it can support daily updates to monitoring recommendations.
What This Means for People Breathing the Air
In simple terms, the study shows that a city does not need sensors on every block to know how clean or dirty its air is. By letting a neural network learn how pollution moves and then carefully selecting the most informative locations, officials can design leaner, smarter monitoring networks that track citywide conditions with very small errors. For residents, this kind of system promises more reliable air-quality maps, better guidance for outdoor activities, and a stronger scientific basis for policies aimed at cutting pollution where it matters most.
Citation: Liu, S., Peng, J. & He, X. Construction of automatic air monitoring point siting model based on convolutional neural network and K-means clustering. Sci Rep 16, 11940 (2026). https://doi.org/10.1038/s41598-026-41078-1
Keywords: urban air quality, sensor placement, deep learning, environmental monitoring, pollution mapping