Clear Sky Science · en
A Collectivism Index for Investigating Cultural Variation in China across Regions and Time
Why How We Live Together Matters
Why do some communities put family and group harmony first, while others stress personal choice and independence? This difference, often called the split between “we” and “me,” shapes everything from how people marry to how they innovate. Yet scientists have struggled to measure it reliably. This paper introduces a new way to track how strongly people in different parts of China lean toward group-focused living, and how that has shifted over nearly four decades. By turning everyday behaviors recorded in national statistics into a single score, the authors give researchers a powerful tool for understanding how culture varies across regions and changes over time.
Turning Daily Life into a Cultural Score
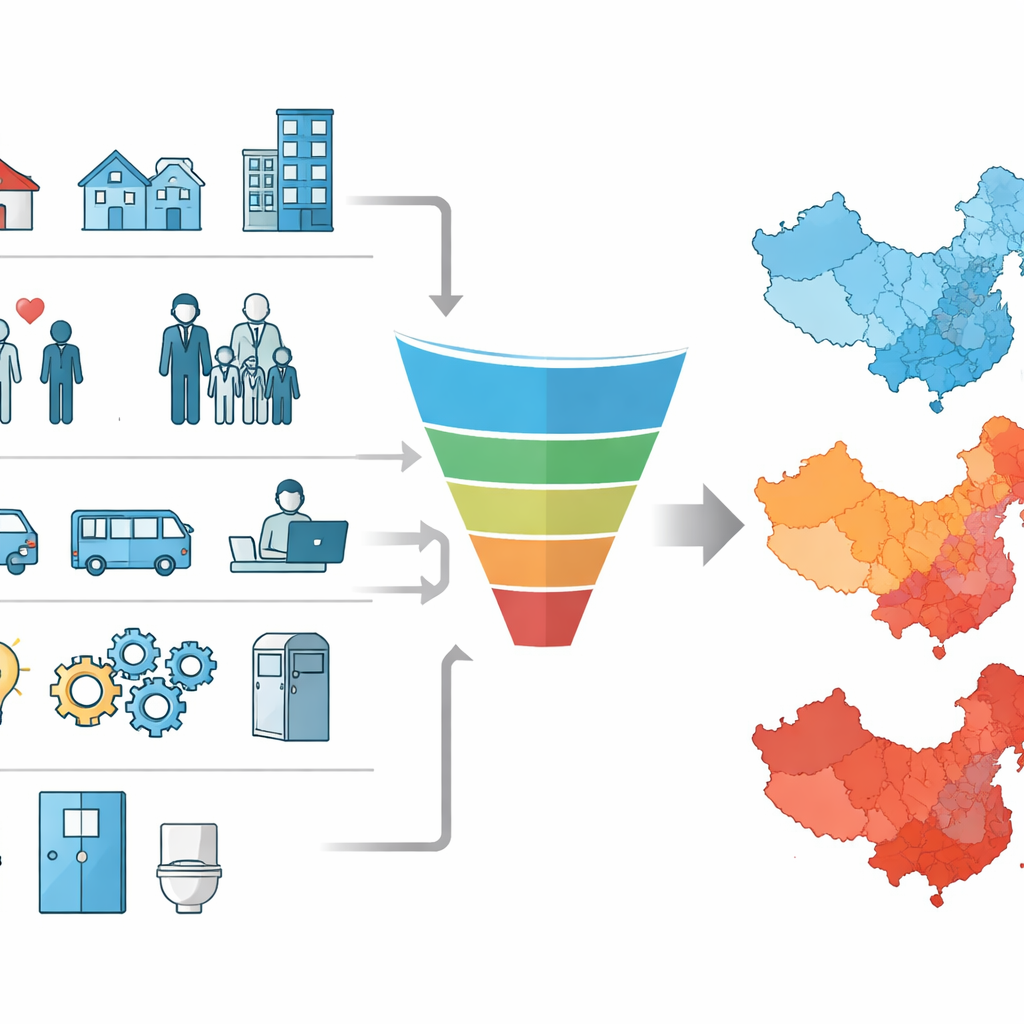
Instead of asking people what they believe about family or society, the authors focus on what people actually do. They build a “collectivism index” from Chinese Census and yearbook data, covering all provinces and hundreds of prefectures from 1982 to 2020. The index uses eight concrete indicators: how often marriages end compared with how often they begin, how many people live alone, how common small nuclear families are, how many households include three generations under one roof, how many people work for themselves, how many private vehicles people own, how many invention patents are granted, and how many public bathrooms are available. These markers reflect a balance between personal freedom and responsibility to close family and community; taken together, they provide a behavioral snapshot of how group‑oriented a region is.
Measuring Places Big and Small
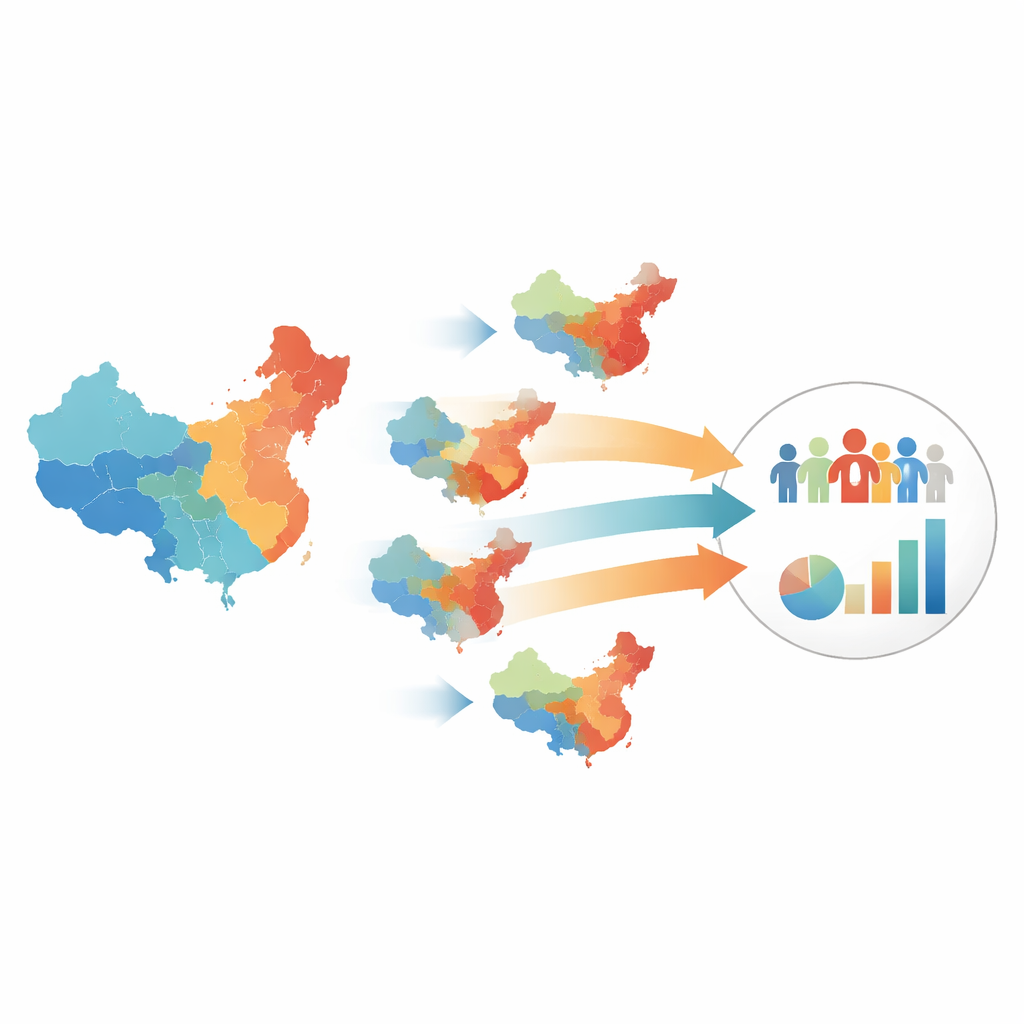
Not all data are available everywhere or in every year, so the authors construct two versions of their index. A four‑indicator version, based only on family and household living arrangements, can be calculated for both provinces and prefectures back to 1982. An eight‑indicator version, which adds work, transportation, innovation, and public services, is available for provinces from 1990 onward. To make the indicators comparable, each is converted into a standard score, and then combined so that higher values mean stronger group ties: more three‑generation households raise the score, while higher divorce rates, more solo living, more private cars, more patents, and more public bathrooms lower it. Maps built from these scores reveal striking regional patterns across China and show how those patterns evolve from 1990 to 2020, with some areas remaining consistently more group‑oriented than others.
Checking That the Index Really Reflects Culture
A key question is whether this new index truly captures cultural differences, rather than just economic development or random noise. The authors test its reliability in several ways. First, they look at how the index behaves over time: provinces and prefectures that score high in one decade generally score high in later decades, suggesting stable regional tendencies rather than year‑to‑year quirks. Statistical tests show that, for most years, the combined indicators hang together well enough to be treated as a single underlying dimension. Next, they compare the index with outside signs of group‑centered life, such as how many people travel to visit family at Chinese New Year, how tightly social rules are enforced, how common family‑run companies are, and how people think and talk online. In most cases, regions that score higher on the index also behave in ways that past research links to stronger group ties.
What Online Words and Money Tell Us
The team also connects their index to language use on Weibo, a major Chinese social media platform. They examine billions of words to see how often people use terms linked to analytical thinking, certainty, possibility, agreement, broad humanity, or hesitant fillers like “uh” and “um.” Regions with higher collectivism scores tend to use fewer words tied to analytic, cause‑and‑effect reasoning and possibility, and more words that signal agreement and small hesitations—patterns that fit earlier findings about more holistic, context‑sensitive thinking in group‑oriented cultures. At the same time, the index does not simply mirror wealth: in many years, richer regions are actually less collectivistic according to these behavioral markers, and the authors take care to adjust for both economic level and the fact that neighboring places are not fully independent from one another.
A New Tool for Tracking Cultural Change
In everyday terms, this work turns scattered facts about how people live, work, travel, and innovate into a single, easy‑to‑use yardstick of how much a region emphasizes the group over the individual. Because it covers most of China, spans nearly forty years, and rests on census‑style data rather than opinion surveys, the index gives researchers an unusually solid foundation for exploring cultural questions. It can help explain why people in some regions think, feel, and behave differently; test ideas about how farming, climate, or institutions shape social life; and watch how the balance between “we” and “me” shifts as China modernizes. For a lay reader, the takeaway is that culture leaves fingerprints in the most ordinary statistics—and with the right tools, those fingerprints reveal how deeply our social worlds shape who we are.
Citation: Wei, L., Talhelm, T., Zhu, J. et al. A Collectivism Index for Investigating Cultural Variation in China across Regions and Time. Sci Data 13, 469 (2026). https://doi.org/10.1038/s41597-026-06661-1
Keywords: collectivism, cultural variation, China regions, social behavior, longitudinal data