Clear Sky Science · en
Comparison and optimization of cellular neighbor preference methods for quantitative tissue analysis
Why cell neighbors matter
Our bodies are made of bustling neighborhoods of cells, not random scatterings. Which cells sit next to which can influence how a tumor grows, how a wound heals, or how a heart recovers after a heart attack. This paper asks a deceptively simple question: when scientists measure which cell types tend to be near each other in tissue images, how reliable are the different methods they use, and can we do better?
How scientists read the cellular city map
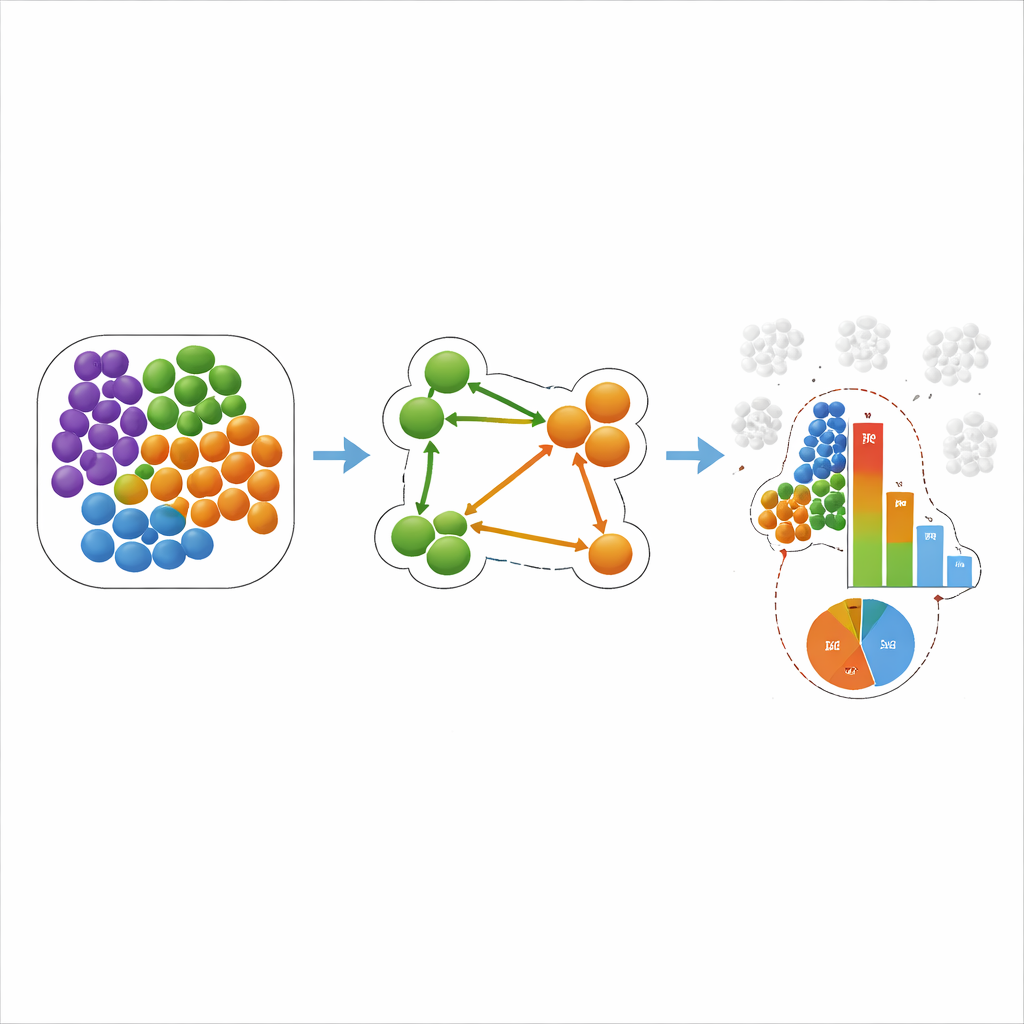
Modern imaging and spatial genomics technologies can record the exact position and identity of thousands of cells in a tissue slice. A popular way to analyze these data is to compute “neighbor preferences”: for a given cell type A, how often does it have cell type B as a close neighbor compared with what would be expected by chance? Many software tools already exist for this task, but they rely on subtly different steps. The authors break these down into three core choices: how to define a neighborhood around each cell (for example, by drawing edges between nearby cells or using a fixed distance), how to count neighbors (treating a pair A–B the same as B–A, or distinguishing direction from A to B versus B to A), and how to turn these counts into a final score (simple normalized counts, permutation-based statistics, or machine-learning measures). This common framework allows a fair, side-by-side comparison of methods.
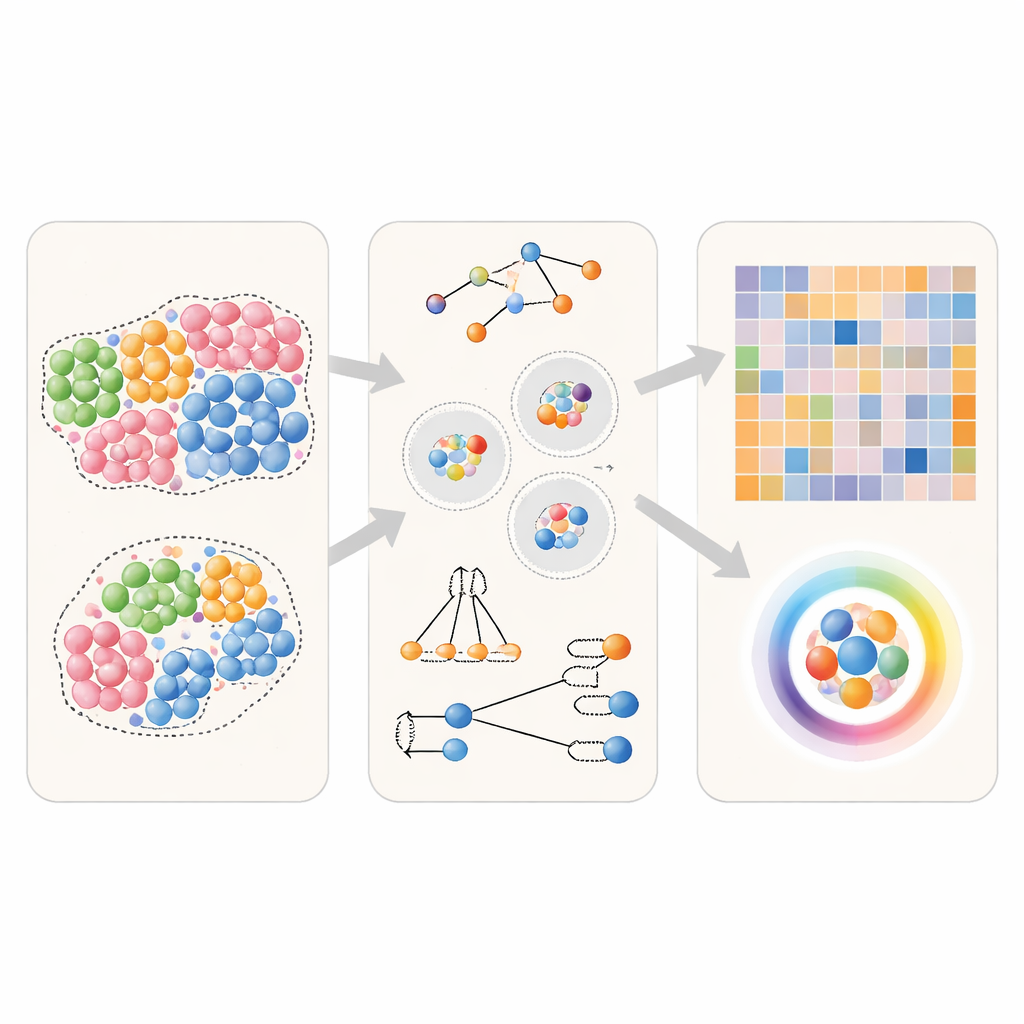
Testing neighbor methods in virtual tissues
To see how well different approaches perform, the team first used computer-generated tissues where the true neighbor relationships are known in advance. They created simple scenarios in which a particular cell type either has no special preference, mildly prefers its own kind, or strongly clusters with itself. They also simulated directional situations in which one cell type preferentially snuggles up to another, but not the other way around. Using these virtual tissues, the authors fed identical data to several widely used tools and then asked: can each method reliably tell these scenarios apart, and can it correctly recover which cell type is seeking which neighbor?
Why direction and subtlety are hard to capture
The comparison revealed that almost all methods can detect large, obvious differences in tissue organization. However, two key weaknesses emerged. First, some tools compress their output into coarse, three-level scores (for example, “below random,” “no difference,” or “above random”), which makes it difficult to distinguish a weak neighbor preference from a strong one. Second, many methods average neighbor counts over all cells of a given type, regardless of whether a particular cell ever meets the other type at all. This “total averaging” tends to blur out directionality, making the relationship from A to B look similar to that from B to A, even when only one direction truly shows a preference. As a result, existing tools can underestimate or even flip the apparent direction of cell infiltration, especially when one cell type is rare and the other is abundant.
A new way to score directional neighbors
To address these issues, the authors introduce a new scoring scheme called the conditional z-score, or COZI. COZI keeps the same idea of comparing observed neighbor counts to many randomized versions of the tissue, but changes how the counts are averaged: it only considers cells of type A that actually touch at least one cell of type B. This “conditional” focus turns out to be crucial for recovering directionality. COZI then converts the result into a continuous z-score, which reflects how strongly the observed pattern deviates from random expectation. To make the scores easier to interpret, the authors add a companion measure, the conditional cell ratio (CCR), which simply reports what fraction of cells of type A participate in the A–B neighborhood at all. Together, the z-score and CCR reveal not only how strong a spatial relationship is, but also whether it is driven by a few specialized cells or by a broad shift in tissue organization.
What this means for cancer and heart disease
The team then applied COZI and other methods to two real-world datasets. In a study of triple-negative breast cancer, previous work had grouped tumors into “cold,” “mixed,” and “compartmentalized” based on how immune cells and tumor cells intermingled. COZI not only reproduced these groupings, but also uncovered directional patterns: for example, in some tumors, immune cells tended to cluster among themselves while a subset of tumor cells reached into these pockets, whereas in others, immune cells were the ones infiltrating tumor regions. In a mouse model of heart attack, COZI traced how neutrophils and monocytes progressively entered the damaged heart muscle, first through the inner lining of the ventricle and then deeper into the injured zone. Importantly, it separated global shifts in cell numbers from true changes in who neighbors whom and in which direction.
Take-home message
This study shows that not all tools for reading cell neighborhoods are created equal, and that small algorithmic choices can strongly shape biological conclusions. By clarifying how existing methods work and introducing COZI plus the conditional cell ratio, the authors provide a roadmap for choosing and interpreting neighbor analyses in spatial tissue data. For non-specialists, the key idea is that understanding who lives next to whom in the tissue “city” — and who is moving into whose territory — can reveal early signs of disease, responses to therapy, and routes for targeted treatment, as long as those patterns are measured with the right tools.
Citation: Schiller, C., Ibarra-Arellano, M.A., Bestak, K. et al. Comparison and optimization of cellular neighbor preference methods for quantitative tissue analysis. Nat Commun 17, 3514 (2026). https://doi.org/10.1038/s41467-026-71699-z
Keywords: spatial omics, cell neighborhoods, tumor microenvironment, immune cell infiltration, computational pathology