Clear Sky Science · en
Integrating geospatial intelligence and machine learning for flood susceptibility mapping
Why this matters for people and places
Floods are among the most damaging natural disasters, and they are becoming more frequent and costly as cities expand into river valleys and the climate warms. Yet many regions still lack detailed, reliable maps that show exactly which areas are most likely to flood. This study explains how scientists combined satellite observations, geographic data, and advanced computer-learning techniques to create highly accurate flood "susceptibility" maps for a large and complex river basin in Iran. The approach they developed could help planners and communities worldwide better understand where future floods are most likely to strike.
Understanding a river basin at risk
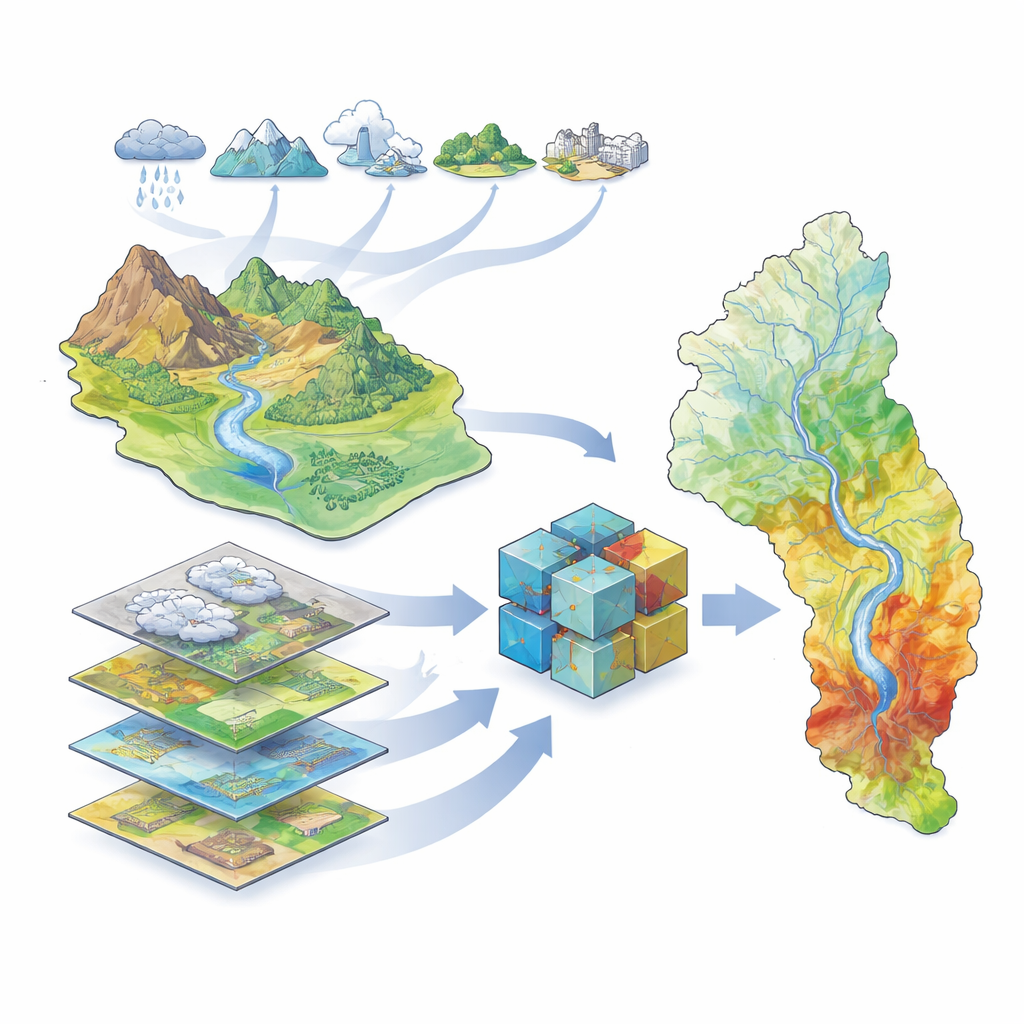
The research focuses on the Great Karun River Basin in southwestern Iran, home to the country’s largest river and to millions of people, farms, and industries. This basin includes high mountains, deep valleys, and low-lying plains, along with more than 40 dams and a history of severe floods, including a destructive event in 2019. Because the landscape and climate vary so much across the basin, predicting where water will accumulate during heavy storms is challenging. The authors assembled a rich set of geographic information describing climate (rain, temperature, evaporation, snow), hydrology (rivers, dams, drainage patterns), land cover (vegetation, soil, geology, urban areas), and topography (elevation, slope, and related indices). Using satellite-based flood records covering 2000–2019, they identified where floods had actually occurred to train and test their models.
Teaching computers to recognize flood-prone land
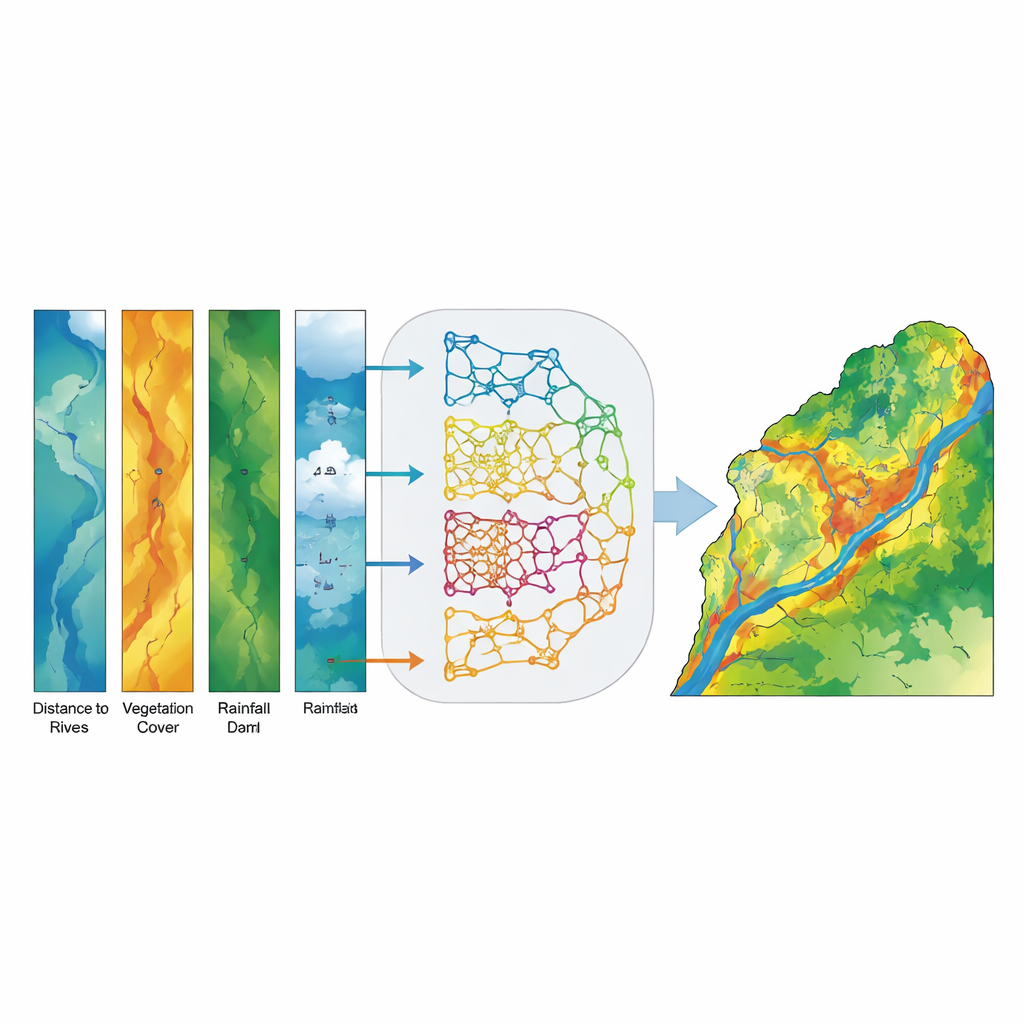
To turn these data into flood susceptibility maps, the team used a family of machine learning methods—computer algorithms that learn patterns from examples rather than following fixed equations. They trained five different models: a traditional statistical model (called a generalized linear model) and four tree-based models that are especially good at handling complex, nonlinear relationships (Decision Tree, Random Forest, XGBoost, and LightGBM). Each model received the same inputs: maps representing the environmental factors and a record of which places had flooded and which had not. The algorithms then learned to associate combinations of factors—for instance, low-lying land near rivers with sparse vegetation—with a higher chance of flooding.
Combining many models into one strong guide
Instead of picking a single "best" model, the researchers built an ensemble, or voting, model that blends the probability estimates from all five base models for every location in the basin. Rather than casting a simple yes-or-no vote, each model contributes a probability that a given pixel is flood-prone, and the ensemble computes an average. This soft-voting strategy reduces the influence of any one model’s errors and emphasizes locations where the different approaches agree. The final output is a continuous map of flood susceptibility, later grouped into five intuitive classes from very low to very high so that decision makers can easily interpret it.
How well did it work, and what matters most?
The ensemble model proved remarkably accurate. When tested against independent data, it correctly distinguished flooded from non-flooded areas with an Area Under the Curve (AUC) score of 0.994, better than any individual model and far above what would be expected by chance. High and very high susceptibility zones closely matched observed flood locations, especially in the downstream plains of Khuzestan Province. An analysis of which factors mattered most showed that distance to streams, ground slope, and vegetation density (measured from satellite images) were the strongest predictors of flood susceptibility, with elevation, flow accumulation, distance to dams, and rainfall providing important secondary information. In simpler terms, being close to rivers, on steeper or converging terrain, and lacking dense vegetation greatly increases the chance that an area will flood.
From maps to action
For a layperson, the bottom line is that this study demonstrates a powerful way to "teach" computers to read the landscape and pinpoint where floods are most likely, even in large, data-scarce regions. By fusing satellite records of past floods with detailed maps of climate, terrain, rivers, and land use, and then combining several machine learning models into a single, stronger ensemble, the authors produced highly reliable flood susceptibility maps for the Great Karun Basin. Such maps can guide safer siting of homes and infrastructure, shape land-use and dam-management policies, and support early warning and emergency planning. Because the method relies mainly on globally available data and widely used tools, it can be transferred to other river basins around the world, helping communities anticipate and reduce flood damage before the waters rise.
Citation: Rahimi, M., Malekmohammadi, B., Firozjaei, M.K. et al. Integrating geospatial intelligence and machine learning for flood susceptibility mapping. Sci Rep 16, 10228 (2026). https://doi.org/10.1038/s41598-026-41014-3
Keywords: flood susceptibility mapping, machine learning, geospatial data, river basin management, disaster risk reduction