Clear Sky Science · en
Growth dynamics of 3,909 Escherichia coli single-gene knockouts in rich and minimal media
Why tracking bacterial growth matters
Bacteria are everywhere, from our guts to industrial fermenters, and their success depends on how fast and how well they grow. Yet even for the familiar lab workhorse Escherichia coli, scientists still lack detailed, standardized records of how thousands of different genetic variants grow over time. This article introduces a large, carefully organized dataset that captures how nearly four thousand E. coli strains, each missing a single gene, grow in rich and poor food conditions. The resource is intended as a shared foundation that anyone can mine to ask new questions about genes, environments, and bacterial behavior.
Many mutant strains, two very different diets
The work centers on the Keio collection, a landmark library of E. coli strains in which almost every nonessential gene has been precisely deleted. From this collection, the authors examined 3,909 different mutants. Each one was grown in parallel in two types of liquid food: a nutrient-rich broth and a minimal medium containing only basic salts, vitamins, and a single sugar. These contrasting diets mimic a feast versus a simple survival ration, allowing researchers to see how missing genes matter when resources are plentiful compared with when they are scarce. 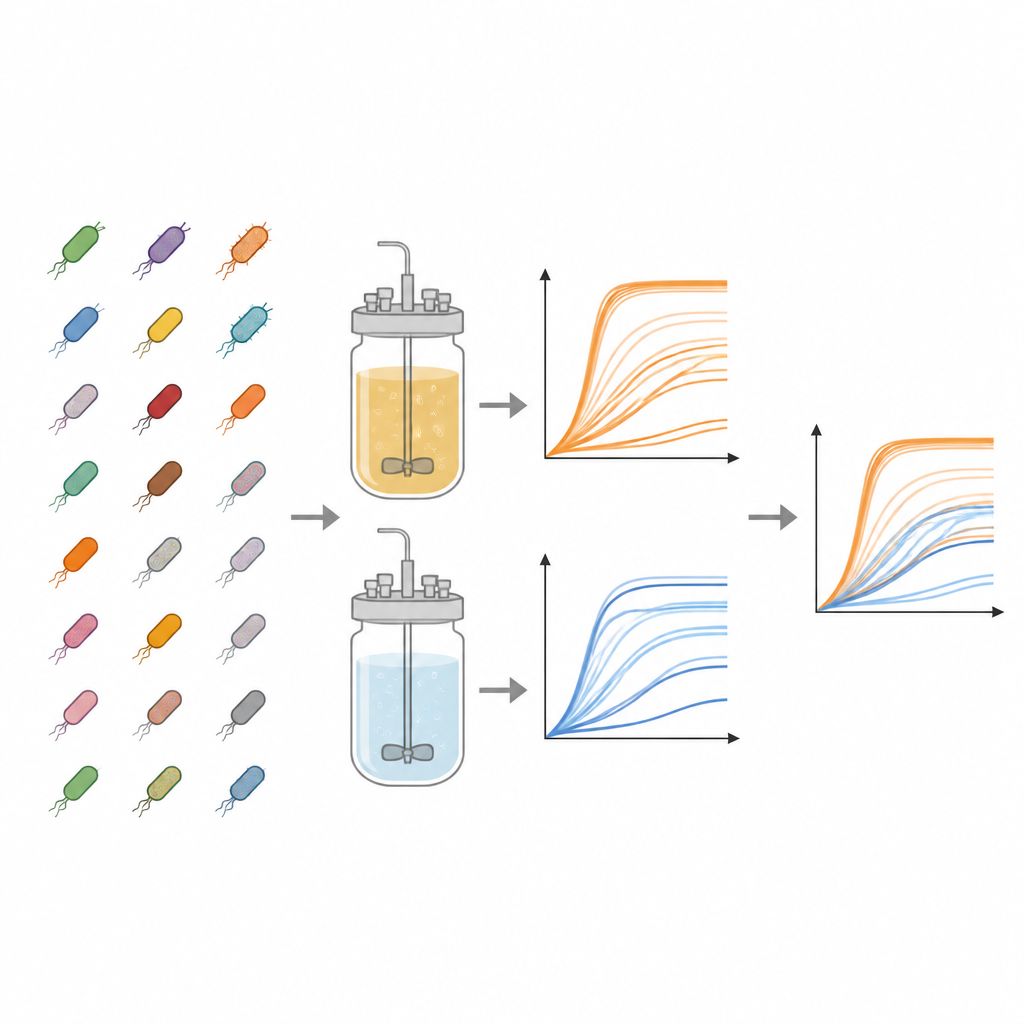
High-throughput monitoring of growth over time
To track how each strain multiplied, the team used standard plastic plates with 96 small wells, filling each well with medium and a tiny amount of frozen bacteria. Plates were incubated at body-like temperature with shaking, while a machine measured the cloudiness of each well every 15 minutes for up to two days. Cloudiness, read as optical density at 600 nanometers, increases as cells multiply, producing a growth curve that shows lag, rapid growth, and eventual saturation. For every combination of strain and medium, the researchers ran three independent experiments, generating 23,454 individual growth curves in total. They subtracted a plate-specific background signal to clean the data and stored all time points in accessible spreadsheet files.
From raw curves to simple descriptors
Because growth curves are rich but complex, the authors also calculated two widely used summary numbers for each curve. One is the carrying capacity, the approximate maximum cloudiness reached, which reflects how dense the culture becomes. The other is the maximal growth rate, the steepest part of the curve, which tells how quickly the population expands during its fastest phase. These values were extracted by a Python program directly from the unsmoothed measurements using short windows of consecutive time points, and the researchers flagged cases where incomplete curves or noisy data might bias the result. In general, both the maximum population size and the fastest growth rate were higher in the rich broth than in the minimal medium, as one might expect from a nutritional standpoint. 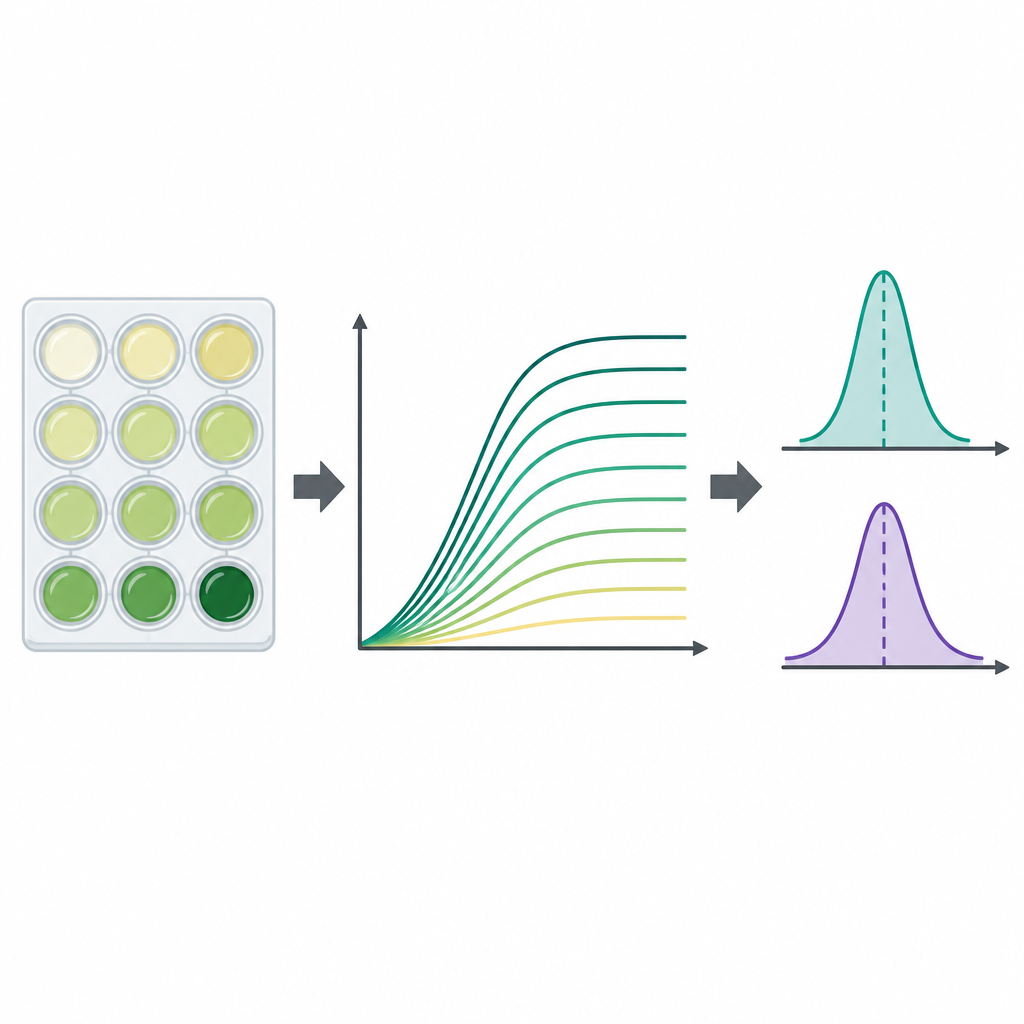
Quality checks and ways to reuse the data
High-throughput experiments can be prone to subtle errors, so the authors carefully quantified how repeatable their measurements were. For each strain and medium, they compared the three replicates and calculated how much the carrying capacity and growth rate varied. They also included markers for potential outliers and for curves where important phases may have been missed due to the fixed recording window. All of this information is bundled with the main data files, enabling future users to choose the subsets that best fit their own quality standards. The dataset is formatted to be machine readable and is accompanied by gene names, identifiers, and broad functional categories for each deleted gene.
What this resource means for future studies
Rather than putting forward a single biological claim, this article delivers a shared, well documented map of how thousands of E. coli mutants grow in two contrasting environments. By making every time point and reliability flag publicly available, the authors invite others to reanalyze the curves, test new mathematical methods, and connect growth behavior to gene function, metabolic networks, or other layers of cellular data. For non-specialists, the key message is that the growth of bacteria is shaped jointly by their genes and their surroundings, and that having a common dataset like this makes it far easier for many groups to study and compare those influences in a consistent way.
Citation: Lao, Z., Ying, BW. Growth dynamics of 3,909 Escherichia coli single-gene knockouts in rich and minimal media. Sci Data 13, 717 (2026). https://doi.org/10.1038/s41597-026-07075-9
Keywords: bacterial growth, Escherichia coli, gene knockouts, growth curves, microbial phenotyping