Clear Sky Science · en
High-Resolution Wind Tunnel Dataset of Gas Sensor Responses to Vapor Plumes in Scale Model Landscapes
Following Invisible Trails in the Air
Imagine trying to track down a gas leak or toxic cloud you cannot see, using machines that can only sniff tiny samples of air one point at a time. That is the challenge facing teams who want drones and robots to help find pollution sources, monitor industrial sites, and even explore the thin atmosphere of other planets. This article presents Red:Vapor, a detailed experimental dataset created in a giant wind tunnel. It shows exactly how a man‑made vapor cloud twists and spreads around a scale model industrial plant, and how different gas sensors on a moving probe respond as they pass through the plume. The result is a rich testbed for scientists and engineers who design smarter gas‑sensing robots and better models of how airborne substances behave.
Why Tracking Airborne Plumes Is So Hard
Gases and aerosols released into the air rarely drift away as smooth, predictable clouds. Wind speed fluctuates, flows become turbulent, and buildings and terrain break up the motion, creating chaotic swirls. At the same time, most chemical sensors behave more like a single pixel than a camera: they give only one value at a point in space and time, and often respond slowly. This means researchers must reconstruct a three‑dimensional, ever‑changing plume from very sparse measurements. Computer simulations can help, but they are expensive to run and hard to check against reality, especially when sensor quirks such as drift, humidity sensitivity, or interference from drone downwash come into play.
Building a Miniature Industrial World in a Tunnel
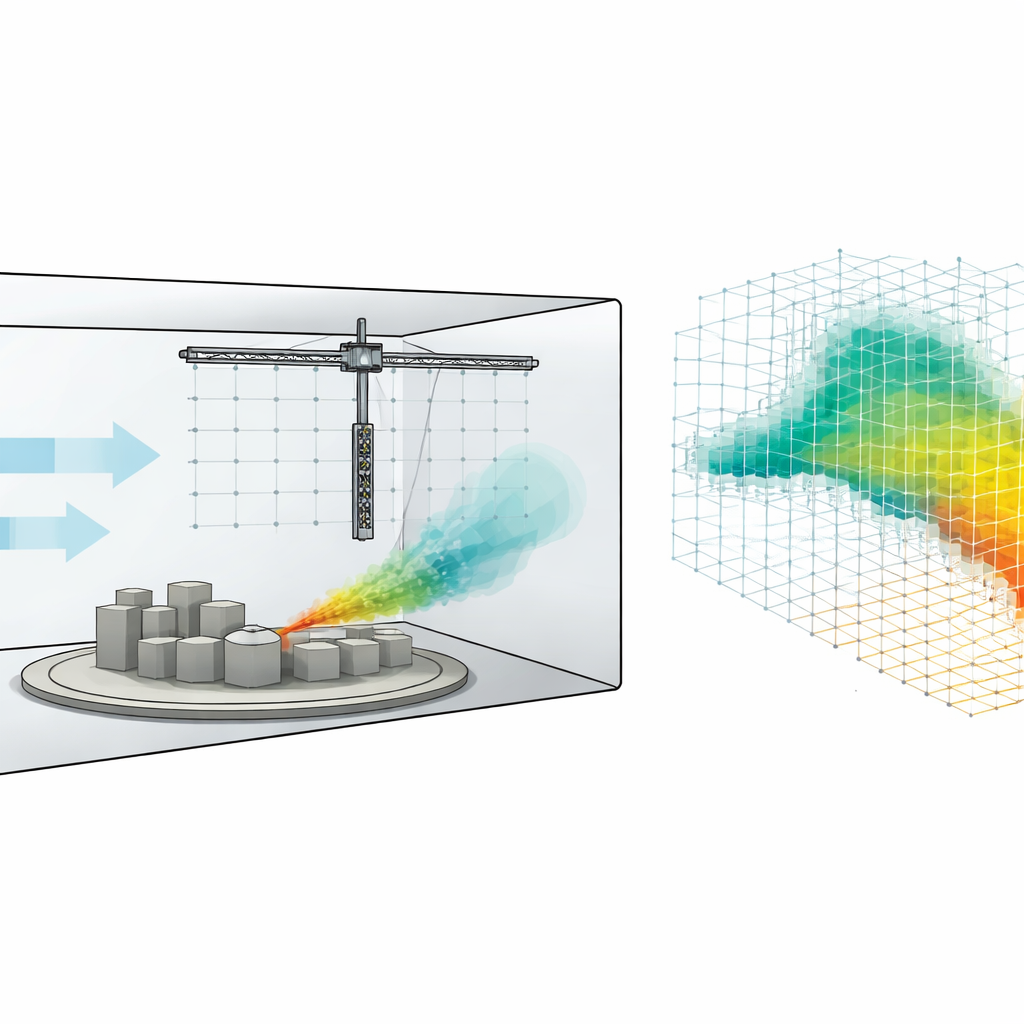
To tackle these difficulties in a controlled way, the team used a low‑speed wind tunnel operated by the German‑Dutch Wind Tunnels facility. Inside its three‑meter‑long test section they mounted a circular turntable carrying scale model buildings, tanks, and stacks that mimic an industrial plant at about 1:50 size. A commercial fog machine under the floor fed a custom fog mixture through a tube into a small opening in a cylindrical tank, mimicking a leak in a storage vessel. The fog mixture contained mostly propylene glycol and triethylene glycol, plus a small amount of ethanol as an easily detectable tracer, forming a visible vapor plume that was also detectable by gas sensors. By rotating the turntable and changing wind speed, the researchers recreated different wind directions and flow regimes, from more orderly streams to complex wakes and vortices behind obstacles.
A Robot‑Like Sniffer That Scans in 3D
Over the model landscape, the authors installed a large computer‑controlled gantry that acted like a precise robot arm. Hanging from it was a vertical probe made of four identical sensor platforms stacked 24 centimeters apart. Each platform carried low‑cost metal‑oxide gas sensors, a more advanced photoionization detector, and small instruments for temperature, humidity, pressure, and three‑dimensional wind speed. With sub‑centimeter accuracy, the probe could be moved to exact points in a 3D grid, pause long enough for the sensors to react, and then move on. In eight "grid" experiments, the team systematically sampled up to 240 × 240 × 96 cubic centimeters of tunnel volume at hundreds of locations. In 22 additional "fly‑through" runs, the probe moved continuously along curved paths that imitate a drone flying through a plume, capturing the dynamic rise and fall of sensor signals as the plume was crossed.
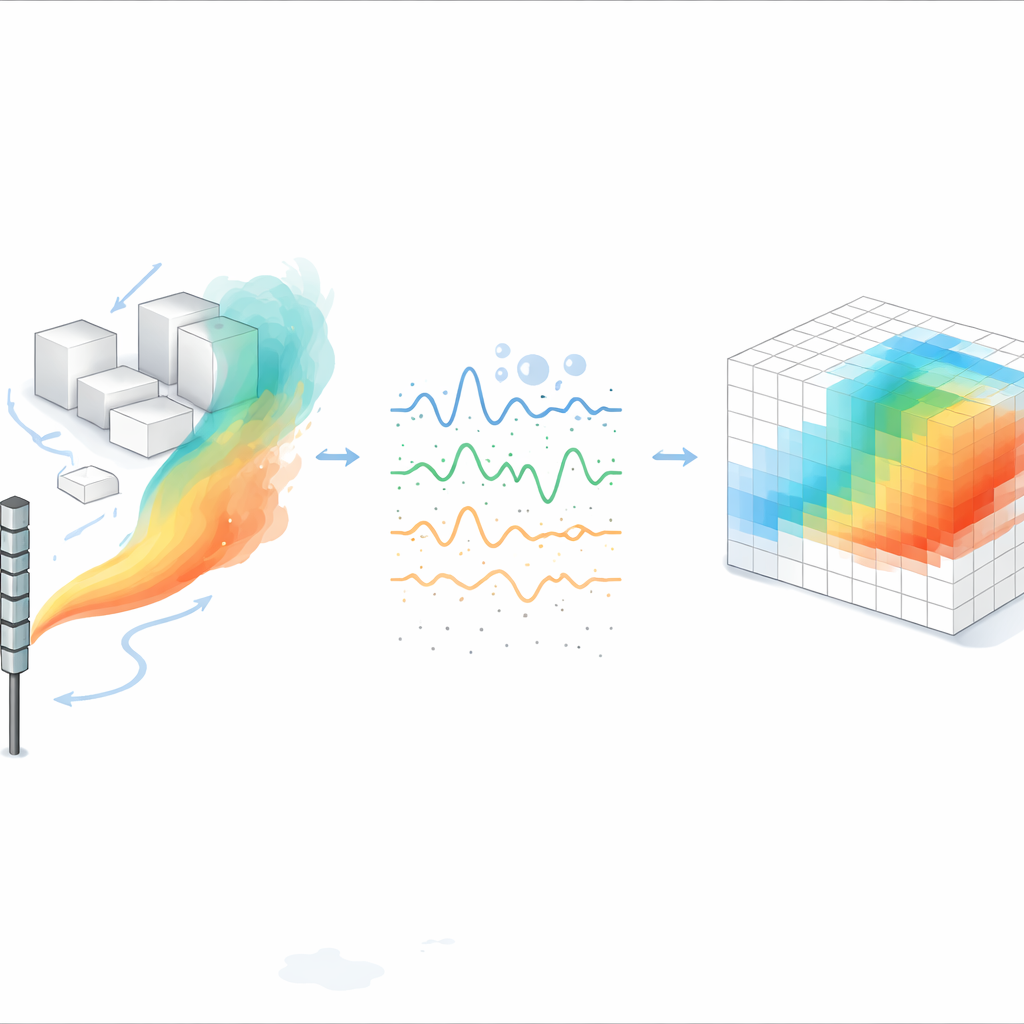
From Noisy Whiffs to Clean 3D Maps
Raw sensor outputs are affected by many factors beyond gas concentration: temperature and humidity can change metal‑oxide sensor resistance, supply‑voltage glitches can shift readings, and the closed‑loop wind tunnel slowly builds up a background level of vapor. The authors therefore devoted much of their work to carefully cleaning and transforming the measurements. They log temperature and humidity alongside sensor resistance, use established physical models to compensate for environmental effects, and convert sensor ratios into concentration‑like values. A pair of fixed "upstream" sensor units in clean air track the slowly rising background, which is then subtracted from all other readings. Finally, for the grid experiments, they average many samples at each location into a single value per quantity, turning the tunnel volume into a 3D array of small cubes (voxels) that store gas level, wind vector, and environmental data.
A Standard Testbed for Smarter Gas‑Sensing Robots
The Red:Vapor dataset goes beyond earlier collections by combining high spatial resolution, full 3D coverage, realistic obstacles, and side‑by‑side recordings from both inexpensive and high‑end sensors, all under carefully monitored wind conditions. It lets researchers compare how cheap metal‑oxide sensors stack up against fast, linear photoionization detectors, explore how long sensors must dwell to capture meaningful readings, and test algorithms for mapping gas distributions and pinpointing sources. Because everything from raw voltages to preprocessed voxel maps and 3D models of the miniature plant is openly available, the dataset can serve as a shared benchmark. For a layperson, the key takeaway is that this work provides a realistic "wind‑tunnel playground" where new ideas for gas‑sniffing robots and data‑driven plume models can be developed, tested, and compared fairly before they are deployed in real industrial sites or even on other worlds.
Citation: Hinsen, P., Wiedemann, T., Shutin, D. et al. High-Resolution Wind Tunnel Dataset of Gas Sensor Responses to Vapor Plumes in Scale Model Landscapes. Sci Data 13, 586 (2026). https://doi.org/10.1038/s41597-026-06927-8
Keywords: robotic gas sensing, wind tunnel experiments, vapor plume mapping, gas sensor dataset, source localization