Clear Sky Science · en
Mountain glacier extents at the Last Glacial Maximum
Why Ancient Ice Still Matters Today
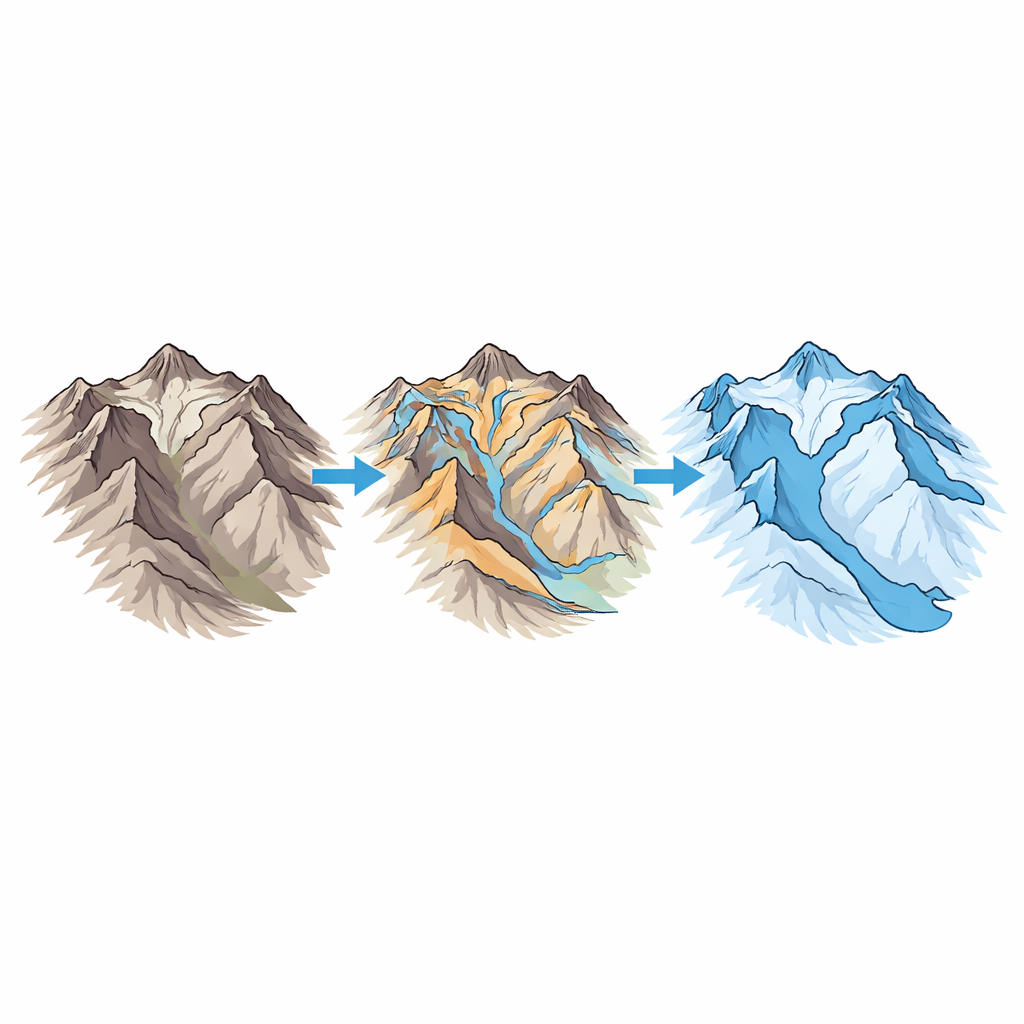
Long before humans began recording the weather, Earth’s mountains silently tracked the rise and fall of ice. During the last ice age, glaciers in high ranges around the world grew far beyond their present limits, carving valleys, redirecting rivers, and reshaping habitats. Knowing exactly how large these glaciers were, and where they spread, is crucial for understanding past climates and for testing the computer models we now use to predict future change. This article introduces GLACIMONTIS, the most comprehensive global map yet of mountain glacier cover during the last great peak of the ice age.
A Global Snapshot of Mountains in the Ice Age
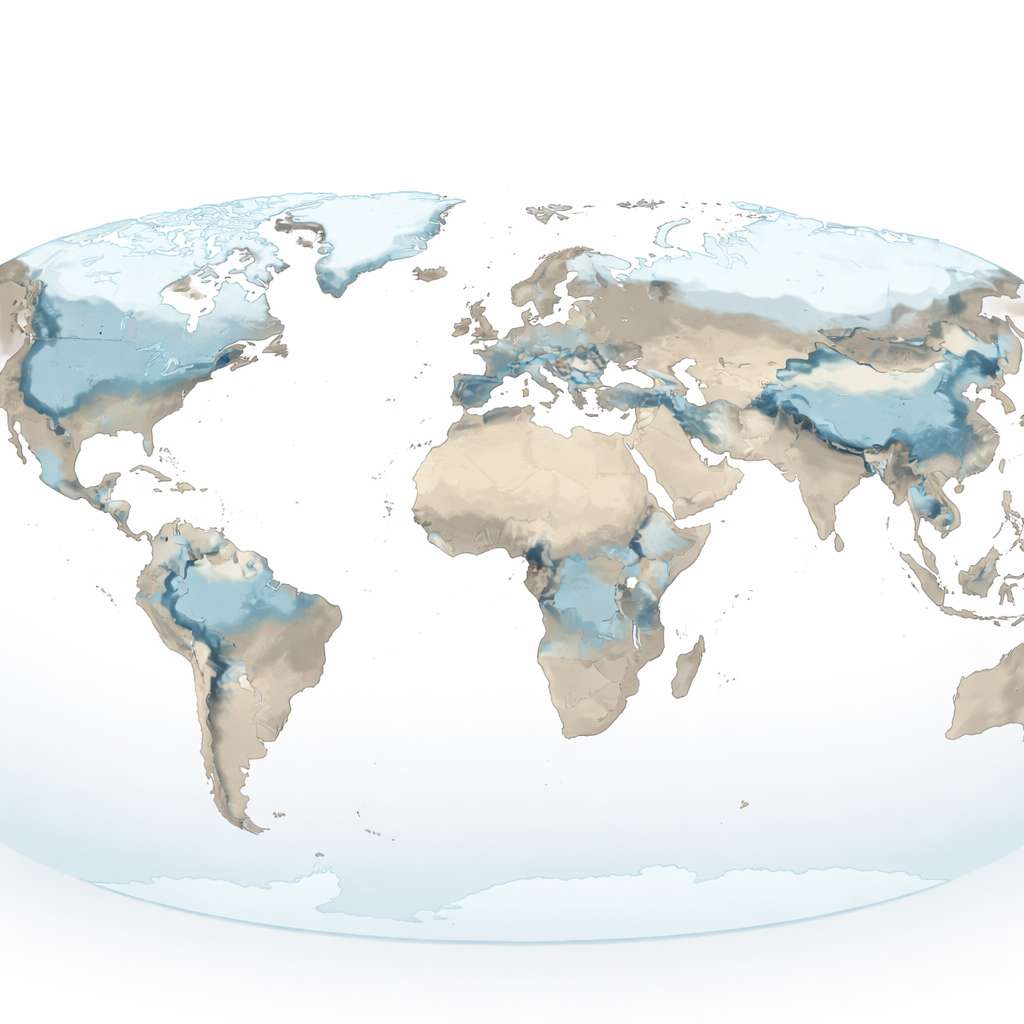
About 26,000 to 19,000 years ago, during what scientists call the Last Glacial Maximum, average global temperatures were several degrees cooler than today and massive ice sheets blanketed much of North America and Eurasia. Beyond these continental giants, smaller but widespread glaciers occupied mountain ranges on every inhabited continent. GLACIMONTIS focuses on these high‑relief regions. The project compiles the largest available collection of mapped outlines showing how far individual mountain glaciers extended during the late stages of the last ice age, broadly between 57,000 and 14,000 years ago. This wider window captures local peaks in glacier size that sometimes occurred earlier or later than the global maximum, acknowledging that not all mountains reached their icy extremes at the same time.
How Researchers Rebuilt Lost Ice
To assemble GLACIMONTIS, the authors blended detective work in the scientific literature with modern mapping tools. They reviewed over 500 publications and ultimately drew on 209 studies that provided clear maps of former glacier limits. In some cases, digital outlines were freely available from online repositories or could be obtained directly from the original authors. In many others, the team had to carefully digitize glacier shapes by hand from printed maps and figures, aligning them with modern coordinate systems. Wherever possible, they also recorded information about when the glaciers were at their greatest extent, how high the snowline sat on the mountains at that time, and how much colder the climate was compared with today.
From Raw Maps to Usable Layers
The resulting GLACIMONTIS geodatabase contains over 15,000 individual glacier reconstructions across 271 mountain ranges worldwide, including more than 8,800 outlines compiled at a global scale for the first time. The authors organized these data into two main products. The first, a detailed collection called Empirically Reconstructed Paleoglaciers, preserves each original outline exactly as published, even when multiple studies disagree in a given region. The second, called Filtered Reconstructed Paleoglaciers, offers a cleaner, ready‑to‑use layer in which overlapping and clearly incomplete outlines are edited into a single best estimate of maximum ice cover for broad‑scale applications. Both products are tied to rich metadata tables that document sources, dating methods, and basic climate indicators, making it easier for users to trace any map back to its original study.
What the Map Reveals About Earth’s Past
GLACIMONTIS does more than place blue patches on a world map. By intersecting glacier outlines with an existing global classification of mountain ranges, the authors assessed which regions were glaciated, which likely remained ice‑free, and where evidence is still too sparse to tell. They found that 94 mountain ranges show signs of glaciation during the last ice age peak, while 67 appear to have stayed unglaciated and 16 remain uncertain. Comparing the new database with an influential 2011 global compilation, they show that more than 130 mountain ranges now have updated or entirely new reconstructions, especially in previously under‑mapped areas such as parts of South America, Africa, and Asia. At the same time, they highlight uneven data access and lingering uncertainties, particularly where maps had to be reconstructed from old figures or where glacier ages are poorly constrained.
Why This Matters for Climate and Life
For non‑specialists, the key message is that the shape of today’s mountain landscapes, and the ecosystems that occupy them, cannot be fully understood without knowing where the ice once stood. GLACIMONTIS provides that missing piece at a global scale. Climate scientists can now use these detailed glacier outlines to test how well climate models reproduce past cold conditions. Ecologists can use the maps to infer where cold‑adapted plants and animals may have survived, and how high habitats have shifted since. Although the database reflects the state of knowledge only up to mid‑2024 and carries uncertainties inherited from the original studies, it marks a major step toward a more complete picture of Earth’s icy past—and a stronger foundation for anticipating how mountains and their glaciers will respond to the warming future.
Citation: Lima, A.C., Dulfer, H.E., Hughes, A.L.C. et al. Mountain glacier extents at the Last Glacial Maximum. Sci Data 13, 629 (2026). https://doi.org/10.1038/s41597-026-06841-z
Keywords: Last Glacial Maximum, mountain glaciers, paleoclimate, glacier mapping, Quaternary geology