Clear Sky Science · en
HRCHY-CytoCommunity identifies hierarchical tissue organization in cell-type spatial maps
How cells build neighborhoods inside our tissues
Our organs are not just bags of cells; they are carefully arranged cities where different cell “neighbors” team up to keep us alive and, in disease, sometimes work against us. New imaging and sequencing tools can now record where every cell sits in a tissue slice, along with what it is doing. But making sense of this dizzying spatial detail is hard. This study introduces HRCHY‑CytoCommunity, a computational method that automatically reconstructs how cells group into neighborhoods and larger districts inside healthy organs and tumors, and links these patterns to patient outcomes.
From cell maps to hidden tissue structure
Modern spatial “omics” technologies can measure thousands of molecules in tens or hundreds of thousands of cells while preserving their exact locations in tissue. Researchers know that cells organize in layers, zones, and compartments—for example, immune versus cancer regions in tumors, or distinct nuclei in the brain. These patterns matter: tumors with immune cells segregated from cancer cells often behave differently from those where they are intermingled, and special immune aggregates called tertiary lymphoid structures can predict better survival in several cancers. However, most existing computer tools either ignore this natural hierarchy or find structures at a single level, making it difficult to see how small cellular neighborhoods fit into larger tissue districts.
A new way to read cellular neighborhoods
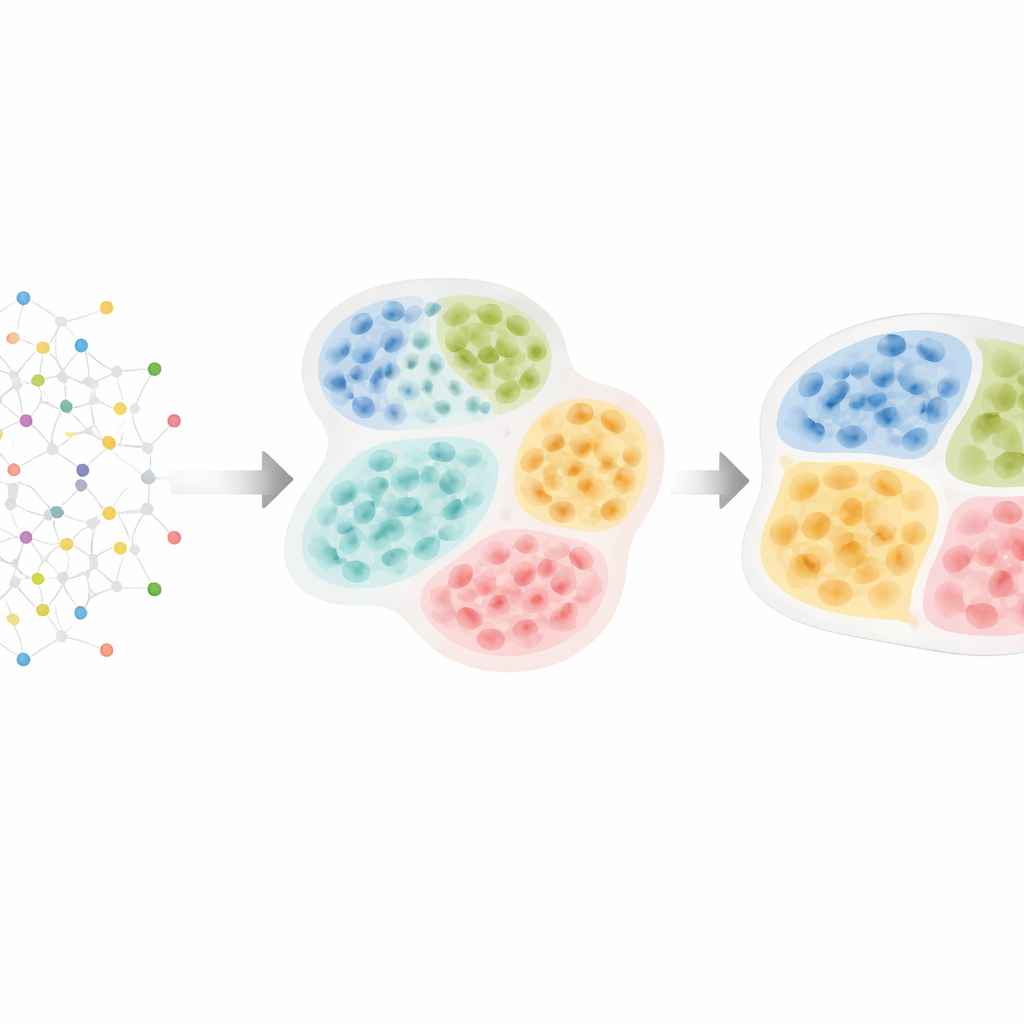
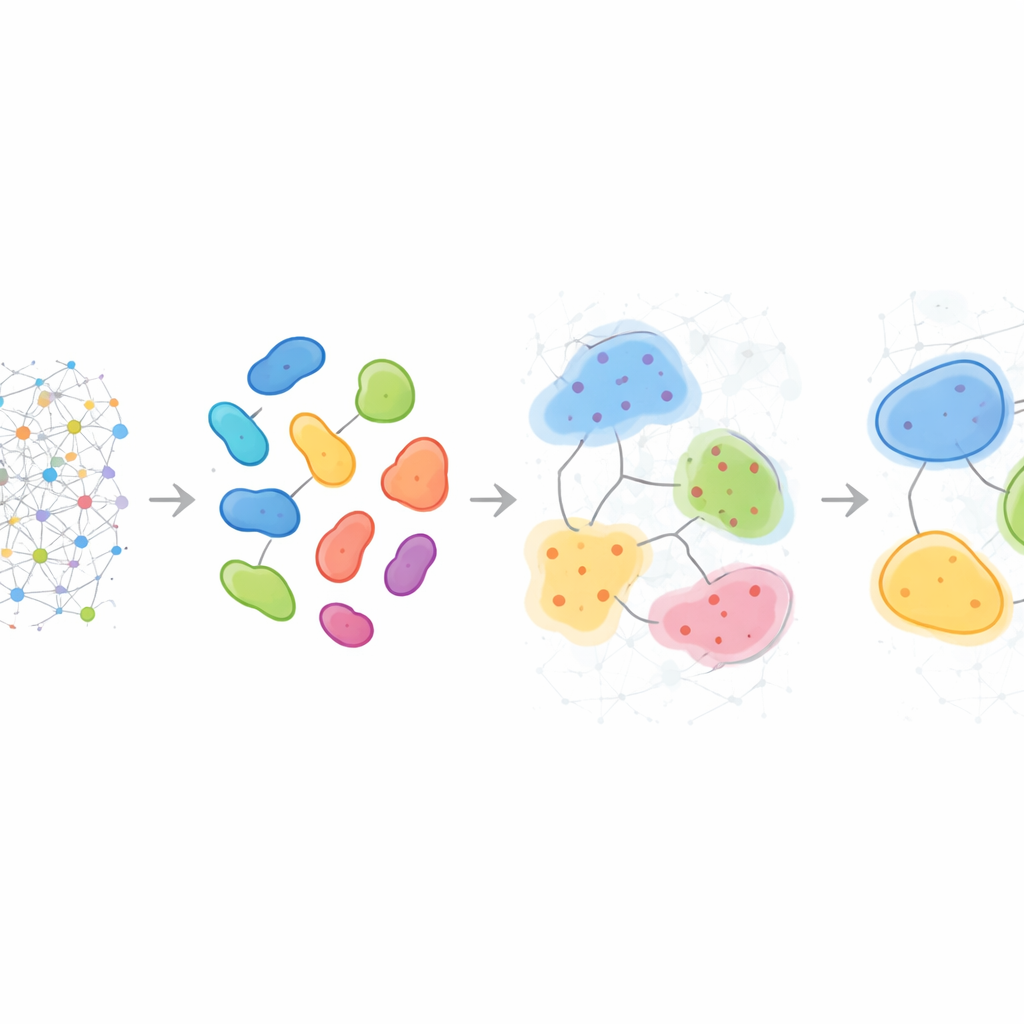
HRCHY‑CytoCommunity tackles this challenge by treating a tissue as a network of cells. Each cell is a node in a graph, connected to its closest neighbors in space. Instead of relying directly on raw gene or protein measurements, the method uses each cell’s type (such as cancer cell, T cell, or fibroblast) as the main input. A graph neural network then learns patterns of how these cell types arrange themselves. In one step it groups nearby cells into fine‑grained “cellular neighborhoods.” In a second step it pools these neighborhoods into coarser “tissue compartments,” ensuring that every cell belongs to exactly one neighborhood and each neighborhood sits cleanly inside a single compartment. Special training tricks—such as pruning weak connections, adding random noise, and encouraging stable, well‑balanced clusters—help the method avoid fragile or trivial groupings.
Finding structure across organs, technologies, and diseases
The authors tested HRCHY‑CytoCommunity on a wide range of spatial datasets from mice and humans, covering both imaging‑based protein maps and sequencing‑based RNA maps, and spanning spleen, brain, intestine, and tumors. In the mouse spleen, the method recovered classic structures such as the red pulp and lymphoid regions, even when those regions were broken into disconnected patches. In colorectal cancer tissue, it cleanly separated tumor from normal areas and highlighted distinct neighborhoods at tumor edges and cores. In mouse brain regions, it accurately traced known, often tiny, nuclei and cortical layers that many other methods blurred together, and it handled very large datasets containing hundreds of thousands of spots in just a few minutes. The framework also works when each measured spot contains mixtures of cell types: by first estimating which cells are present in each spot, it can still reconstruct anatomically meaningful layers and subregions.
Patterns that differ from patient to patient
Beyond describing single samples, HRCHY‑CytoCommunity can align neighborhoods and compartments across many patients to define a shared “vocabulary” of multicellular structures. In triple‑negative breast cancer, the method consistently found broad immune‑rich and cancer‑rich compartments, yet the finer neighborhoods within them differed from person to person. Some tumors contained unique combinations of macrophages, T cells, and blood vessels, or mixed cancer–neutrophil pockets, revealing individualized micro‑ecologies invisible to simple counts of cell types. When applied to a large breast cancer cohort, these multi‑scale structures helped stratify patients by survival: one compartment enriched in a particular cancer cell phenotype marked patients with better outcomes, while certain neighborhoods rich in fibroblasts or specific T cell and macrophage mixes flagged groups with significantly worse prognosis, likely reflecting physical or functional barriers to effective anti‑tumor immunity.
What this means for understanding and treating disease
By turning complex spatial maps of cell types into a clear hierarchy of neighborhoods and districts, HRCHY‑CytoCommunity offers a powerful lens on how tissues are built and how they break down in disease. The method’s ability to work across different experimental platforms, handle huge datasets, and provide complete, nested coverage of cells makes it a practical tool for both basic biology and clinical research. In cancers, it can reveal micro‑architectures linked to patient survival and response to therapy; in healthy organs, it can chart how specialized regions cooperate. Ultimately, approaches like this could help doctors read tissue organization as routinely as they read lab tests today, guiding more precise diagnoses and treatments.
Citation: Xie, R., Wang, Z., Liu, J. et al. HRCHY-CytoCommunity identifies hierarchical tissue organization in cell-type spatial maps. Nat Commun 17, 3312 (2026). https://doi.org/10.1038/s41467-026-70069-z
Keywords: spatial omics, tissue architecture, graph neural networks, tumor microenvironment, cellular neighborhoods