Clear Sky Science · en
Reframing urban sustainability indicators: a sufficiency-oriented analysis of SDG 11 in European voluntary local reviews
Why city scorecards matter for everyday life
Across Europe, more and more cities publish glossy reports showing how well they are doing on the United Nations goal for “Sustainable Cities and Communities” (SDG 11). Behind the charts and maps are hundreds of numbers meant to track housing, transport, green areas and more. This article asks a simple but crucial question: do these numbers actually tell us whether cities are moving toward a fairer, lighter way of living within the limits of the planet—or do they mostly reassure us that business as usual is on the right track?
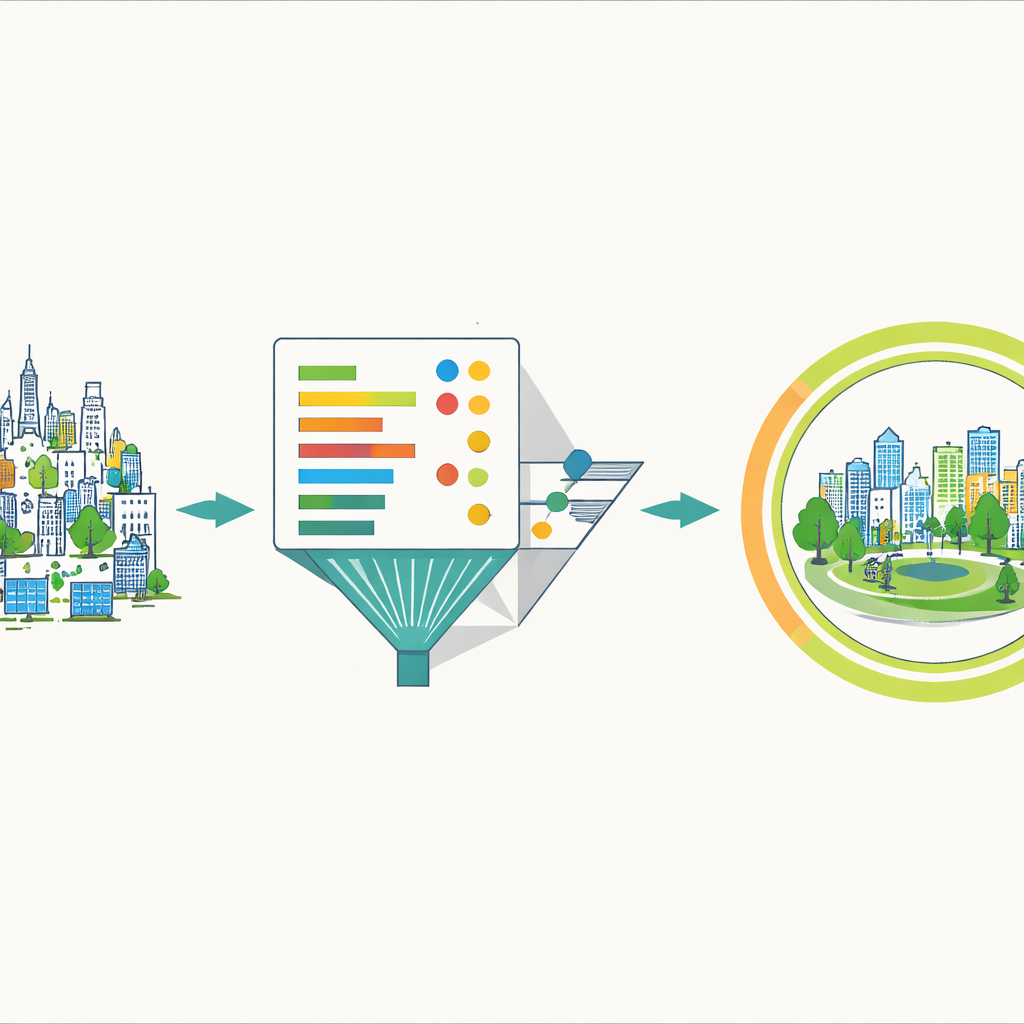
Looking under the hood of city sustainability reports
The authors examined 384 SDG 11 indicators used in local sustainability reports, called Voluntary Local Reviews, from 30 European cities. They sorted every indicator into the official SDG 11 sub-goals (such as housing, transport or green space) and then grouped them into 76 recurring themes, like “living space per person” or “air quality.” The key yardstick was the idea of “sufficiency”: not just doing things more efficiently, but asking how much housing, mobility, or consumption is enough for a good life for everyone without overshooting environmental limits. They also extended this lens to two often ignored dimensions—whether basic needs are protected from market pressures (“decommodification”) and whether people really share in shaping decisions (“democratization”).
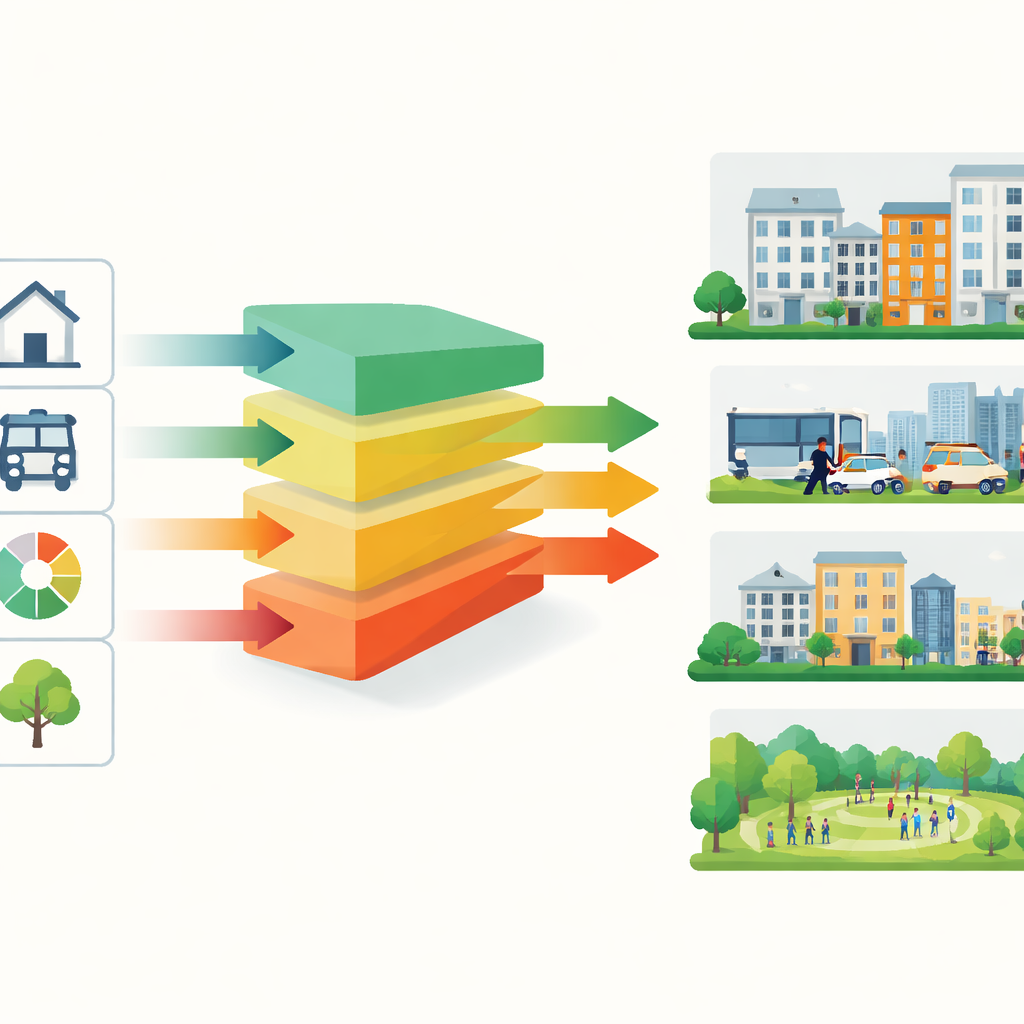
What the numbers miss on homes, transport and land
Some of the most sensitive areas for daily life—housing and mobility—are indeed covered, but often in narrow ways. Many cities count average rents, total social housing units or car ownership, yet rarely connect these figures to actual needs, income levels or clear limits. Indicators that would show whether everyone can afford a decent home, how long people wait for social housing, or how much living space per person is reasonable are used only in a minority of cases. In transport, cities like to track shares of car, bike and public transit use, or the spread of electric cars, but seldom measure walking conditions, transport poverty, or whether public transport is truly accessible and affordable for vulnerable groups. Land-use indicators typically show how much land is built over, but seldom ask who controls that land or whether growth in built areas could be replaced by reusing what already exists.
Invisible boundaries and silent power imbalances
Across all topics, the study finds that the most important boundaries are usually invisible in the data. Very few indicators are tied to concrete target values that would define what counts as “too much” land take, floor space, car use or pollution, or as “too little” social housing or green space. Likewise, the ways in which markets and power relations shape cities rarely show up. Only scattered examples touch on public or cooperative ownership, remunicipalizing services, or curbing speculation in housing. Participation is mostly reduced to counting meetings or online consultations, with little sense of who participates or how much influence they really have. This means that reports can give an impression of progress while leaving untouched the structures that drive high resource use and inequality.
Is the environment really getting better?
Where cities do highlight environmental impacts—air quality, waste, noise, or green spaces—the picture is mixed. Air pollution is widely measured, often against outdated or very loose standards that are easy to meet, potentially hiding ongoing health risks. Waste volumes and recycling rates appear only occasionally, and almost never distinguish between different kinds of waste or show how much is simply exported elsewhere. Green parks and public spaces are often lumped together into single figures that do not reveal who can reach them, how they are distributed across neighborhoods, or whether they actually help cool cities and absorb water during heat waves and storms. Crucially, links between social conditions and environmental burden—who breathes the dirtiest air, who lacks shade, who lives near noisy roads—are rarely drawn.
How cities could turn indicators into real change
Despite these gaps, the authors see promising examples that hint at a different path. Some cities monitor waiting times for social housing, energy use in public buildings, or the share of trips made by walking and cycling. Others describe efforts to buy back energy networks or limit speculative investment in housing. If such indicators were broadened and paired with firm targets—like maximum living space per person, caps on car use, minimum shares of decommodified housing, or guaranteed access to green space within walking distance—they could help cities confront uncomfortable questions about overconsumption and inequality. The article concludes that today’s urban scorecards risk reinforcing an unsustainable status quo, but with a sufficiency lens that centers fair access, shared control and hard environmental and social limits, they could become tools for steering cities toward a “good life for all” within the Earth’s boundaries.
Citation: Beyer, S., Koch, F. Reframing urban sustainability indicators: a sufficiency-oriented analysis of SDG 11 in European voluntary local reviews. npj Urban Sustain 6, 52 (2026). https://doi.org/10.1038/s42949-026-00375-4
Keywords: urban sustainability, sufficiency, SDG 11, voluntary local reviews, city indicators