Clear Sky Science · en
Keeping up with the regions: a hybrid machine learning framework for estimating regional input-output tables
Why regional economies matter
When a factory closes, a new hospital opens, or a port is expanded, the effects ripple far beyond the immediate workplace. Economists use detailed "input–output" tables to trace how money and jobs flow between sectors such as farming, manufacturing, and services. Yet for most regions within countries, building these tables is so costly and data-hungry that they are updated rarely, if at all. This article presents a new way to estimate those regional economic maps using modern machine learning, promising faster and more accurate tools for planners, analysts, and anyone interested in how local economies are wired together.
The puzzle of mapping local economic links
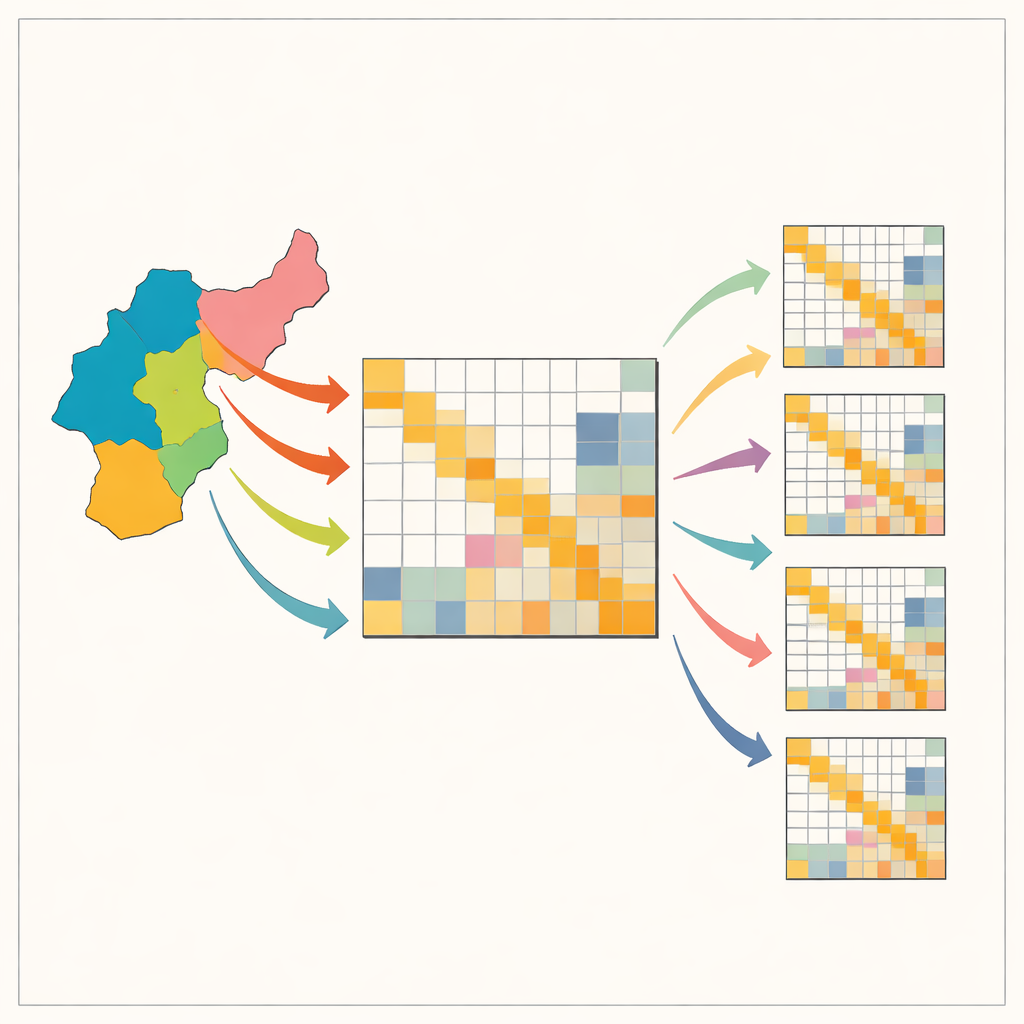
Input–output tables describe who buys what from whom in an economy: how much steel carmakers purchase, how many legal services manufacturers use, and so on. National tables exist for many countries, but local versions—for states, provinces, or city-regions—are often missing because they require large, expensive surveys. To get around this, economists typically start from the national table and reshape it with simple mathematical recipes so that it matches whatever regional totals are known, such as employment or output by sector. Popular shortcuts, with names like location quotients and RAS, are cheap and fast but can distort crucial patterns, especially the tendency of industries to buy heavily from themselves and a few key partners. These distortions can mislead decisions on infrastructure, climate policy, or shock preparedness.
Blending old economics with new algorithms
The authors propose a hybrid framework that marries classic economic structure with state-of-the-art artificial intelligence. At its heart is a type of generative model called a GAN, commonly used to create realistic images. Here, instead of pictures, the GAN learns to create whole input–output tables that resemble those observed in historical data. A special internal layer forces every generated table to respect hard accounting rules: row and column totals must match known regional figures and entries cannot be negative. This keeps the machine learning model grounded in basic economics rather than letting it chase purely statistical patterns.
Fine-tuning the rough draft
Even a well-trained GAN tends to make small, systematic mistakes—for instance, slightly underestimating how strongly certain sectors trade with themselves. To fix this, the authors add a second stage known as residual boosting. After the GAN produces its best guess, a separate ensemble of decision-tree models learns the typical errors it makes and predicts a correction. The corrected table is then gently adjusted to avoid unrealistic values. This two-step design takes advantage of the GAN’s skill at capturing the big picture—such as the overall shape and concentration of flows—while using the booster to sharpen local details. The method is also informed by the fact that real economies have a few very large flows and many tiny ones, a skewed pattern the model is explicitly encouraged to mimic.

Putting the method to the test
To see whether this hybrid approach works in practice, the authors test it on two major datasets: a collection of national tables from many countries and a set of world input–output tables that describe global supply chains across dozens of industries and regions. Because the true tables are known in these cases, the researchers can compare their estimates directly against reality and against improved versions of the traditional RAS method. Across a wide range of yardsticks—overall fit, average errors, how well the main diagonal is reproduced, and how closely the uneven spread of large and small flows is preserved—the hybrid method comes out ahead. In the national dataset it improves the standard goodness-of-fit measure by nearly nine percentage points relative to improved RAS, and it more than doubles the accuracy with which self-use within sectors is captured. On the global tables, it achieves even closer agreement, almost perfectly reproducing the underlying structure.
What this means for real-world decisions
For non-specialists, the key message is that we can now build much more reliable pictures of regional economies without sending survey teams door to door. The hybrid model keeps the familiar accounting logic that policy analysts trust but lets advanced machine learning discover subtle regularities that older tools miss. Better regional input–output tables translate into more credible estimates of how local shocks spread, which sectors are most critical, and how policies will reverberate through jobs, incomes, and emissions. While the method still depends on having good training data and more computing power than traditional approaches, its strong performance suggests that modern data science can significantly sharpen the lenses through which we view regional development, resilience, and structural change.
Citation: De Pretis, F., Tortoli, D. & Caria, S. Keeping up with the regions: a hybrid machine learning framework for estimating regional input-output tables. Sci Rep 16, 10893 (2026). https://doi.org/10.1038/s41598-026-45382-8
Keywords: regional input-output tables, economic networks, machine learning, generative models, regional development