Clear Sky Science · en
Batch Distillation Data for Developing Machine Learning Anomaly Detection Methods
Why watching for trouble in chemical plants matters
Chemical plants quietly underpin modern life, making fuels, medicines, plastics, and countless everyday products. But when something in these complex systems goes wrong—when a pump clogs, a valve sticks, or a sensor drifts—the consequences can range from wasted material to dangerous accidents. Engineers increasingly hope to use modern artificial intelligence to spot early warning signs automatically. Yet there is a basic obstacle: advanced algorithms need large amounts of high-quality, real-world data to learn from, and such data are rarely shared outside industry. This paper tackles that obstacle head-on by building a small but sophisticated distillation plant in the lab and using it to create and openly release a rich dataset of both normal behavior and carefully engineered faults.
A tabletop stand-in for a full chemical plant
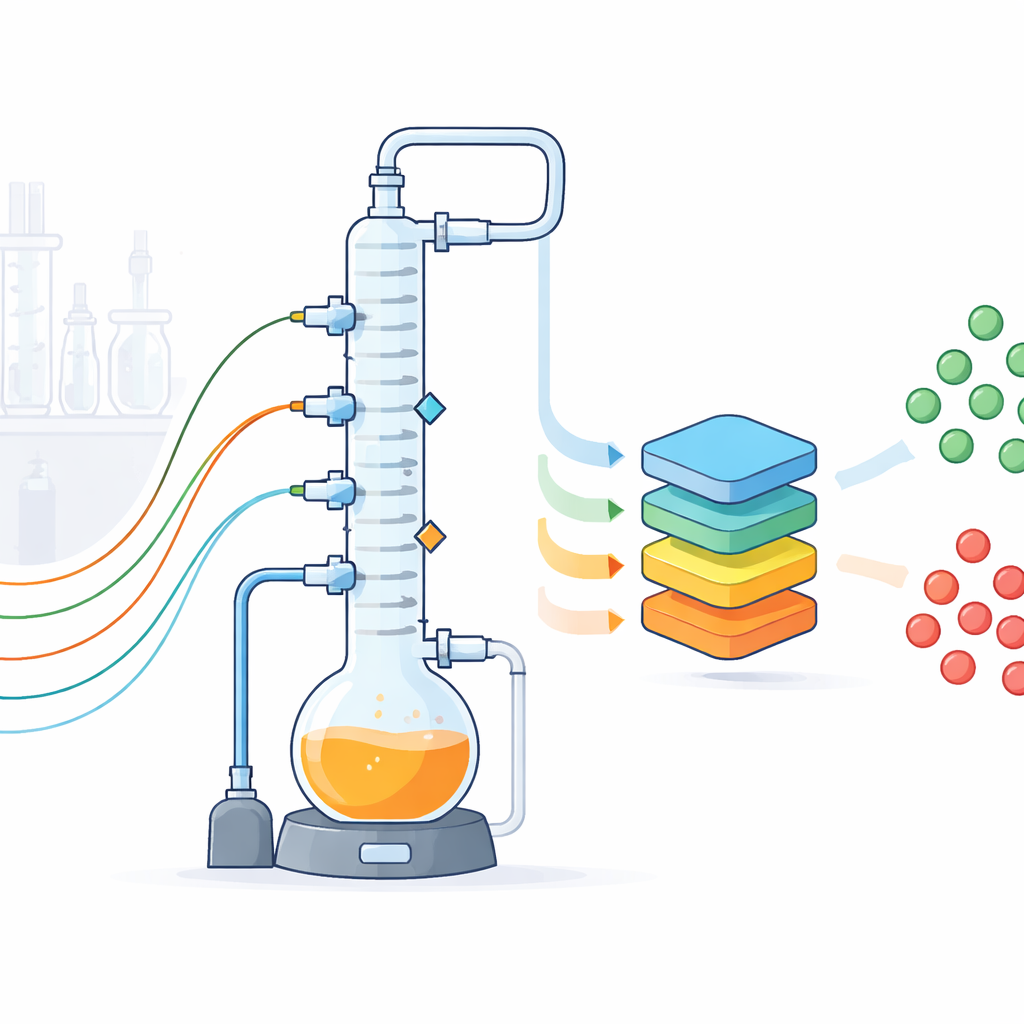
The researchers designed a glass-walled batch distillation setup that mimics a common industrial separation step, where a heated mixture is boiled and its vapors are separated in a tall column into lighter and heavier components. Their laboratory plant includes a two-liter boiling vessel, a three-section column packed to enhance separation, condensers, pumps, and a vacuum system that lets them operate below atmospheric pressure. While the equipment fits on a lab bench, it is built to behave like a scaled-down industrial unit, with realistic piping, insulation, and control hardware. Because the plant is transparent, flexible, and accessible, the team can experiment freely in ways that would be risky or impractical in a factory.
Watching every move with many kinds of sensors
To turn this plant into a data factory, the authors equipped it with an array of conventional and unconventional sensors. Standard instruments measure temperatures at several points up and down the column, pressures, liquid levels, and flow rates of product, reflux, and cooling water. Each sensor’s accuracy and uncertainty were calibrated and documented. On top of these, three cameras record images of key vessels and the condensers every two seconds, a microphone listens to the sounds of pumps and boiling, and a compact nuclear magnetic resonance (NMR) spectrometer continuously tracks how the mixture’s composition changes with time. Additional samples are analyzed with gas chromatography. All devices are tied together by a Python-based control system that runs recipes, logs every event and setting change, and streams readings every second into structured files, with missing values clearly flagged.
Creating and labeling faults on purpose
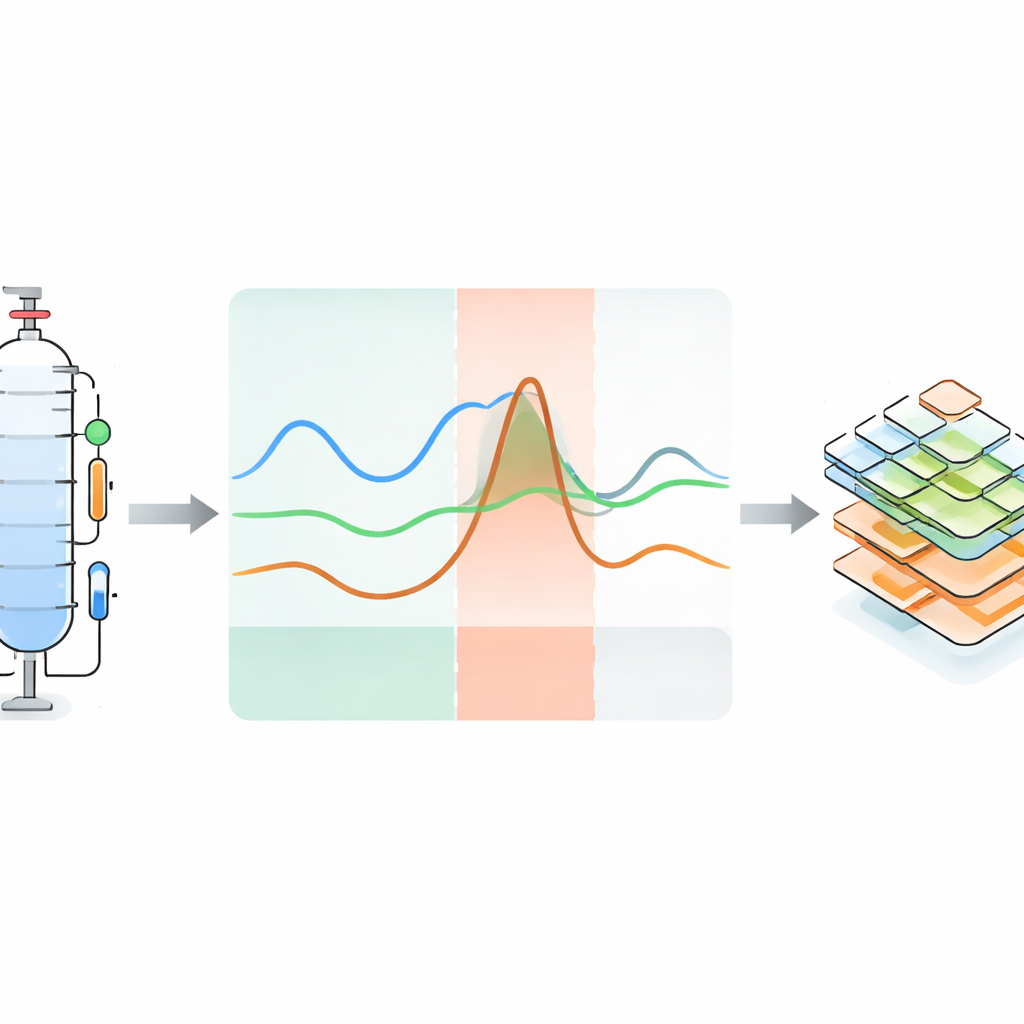
The heart of the project is not just collecting data from routine runs, but deliberately making the plant misbehave in controlled ways. Across 119 experiments, the team carried out both fault-free and faulty runs for several liquid mixtures. During operation, they introduced perturbations such as temporarily changing heater power or column pressure, altering cooling, disturbing the reflux split, injecting extra substances, or corrupting sensor signals. Each perturbation leads to an “anomaly”—a visible deviation in one or more sensor traces. The response is naturally divided into three phases: an initial blind phase where the change has not yet shown up in the readings, an anomalous phase where the deviation is clear, and a recovery phase where the system drifts back toward normal once the fault is removed. Some experiments never fully recover, mimicking serious industrial failures. For many anomalous runs, a close matching normal run under the same conditions is also provided.
Turning process hiccups into machine-readable knowledge
Recognizing that numbers alone are not enough, the authors attach detailed metadata that explain what happened in each anomalous run and why. They build on existing ontology frameworks—formal vocabularies for describing sensors, systems, and failures—to encode, in a structured way, the type of perturbation, the affected component, the observable effect, and the timing of each phase. These descriptions are stored in human-readable YAML files but are also machine-interpretable, linking specific anomalies to specific sensors and parts of the plant. The dataset is organized hierarchically: users can navigate from general information about the plant, to particular hardware configurations and operating points, down to individual experiments with associated time-series, images, audio, NMR data, uncertainty information, and anomaly annotations.
Putting modern AI methods to a real-world test
To demonstrate the value and difficulty of the dataset, the authors applied a range of state-of-the-art time-series anomaly detection methods, including forecasting models, reconstruction-based approaches, generative models, and hybrids that earlier had shown excellent results on a well-known synthetic benchmark called the Tennessee-Eastman Process. On that simulated data, these methods again scored very highly. But when trained on a subset of the new experimental batch distillation data and evaluated using a standard precision–recall metric, their performance dropped sharply across the board. This contrast underscores how much messier and more challenging real process signals are compared with idealized simulations, with richer noise, subtle drifts, and complex couplings between variables.
What this means for safer and smarter plants
To a non-specialist, the key takeaway is that this work supplies the missing “training ground” that modern AI needs to become truly useful for monitoring chemical operations. By openly releasing a carefully documented, multi-sensor record of a realistic distillation process—complete with known faults and expert explanations of their causes—the authors give researchers a common, demanding testbed. Future studies can use these data to benchmark algorithms, develop more transparent and explainable models, and explore strategies for not just detecting anomalies but also understanding and mitigating them. In the long run, advances built on datasets like this could help real plants catch problems earlier, reduce waste, and operate more safely.
Citation: Arweiler, J., Jungjohann, I., Muraleedharan, A. et al. Batch Distillation Data for Developing Machine Learning Anomaly Detection Methods. Sci Data 13, 513 (2026). https://doi.org/10.1038/s41597-026-07124-3
Keywords: anomaly detection, batch distillation, chemical process data, machine learning, time-series dataset