Clear Sky Science · en
China material stocks and flows account for 2019–2023
Why the weight of our world matters
Every road we drive on, every apartment tower on a city skyline, and every appliance humming in our homes is made of physical stuff—concrete, steel, glass, plastic, wood. In China, the sheer volume of this built environment has grown at breathtaking speed, reshaping landscapes and driving global demand for raw materials. This study assembles the most detailed picture to date of how much material China has accumulated, where it is located, and how that pattern has changed from the late 1970s up to 2023. Understanding this “hidden weight” of society helps explain past growth, anticipate future waste and recycling needs, and design policies for a more resource‑efficient and climate‑friendly future. 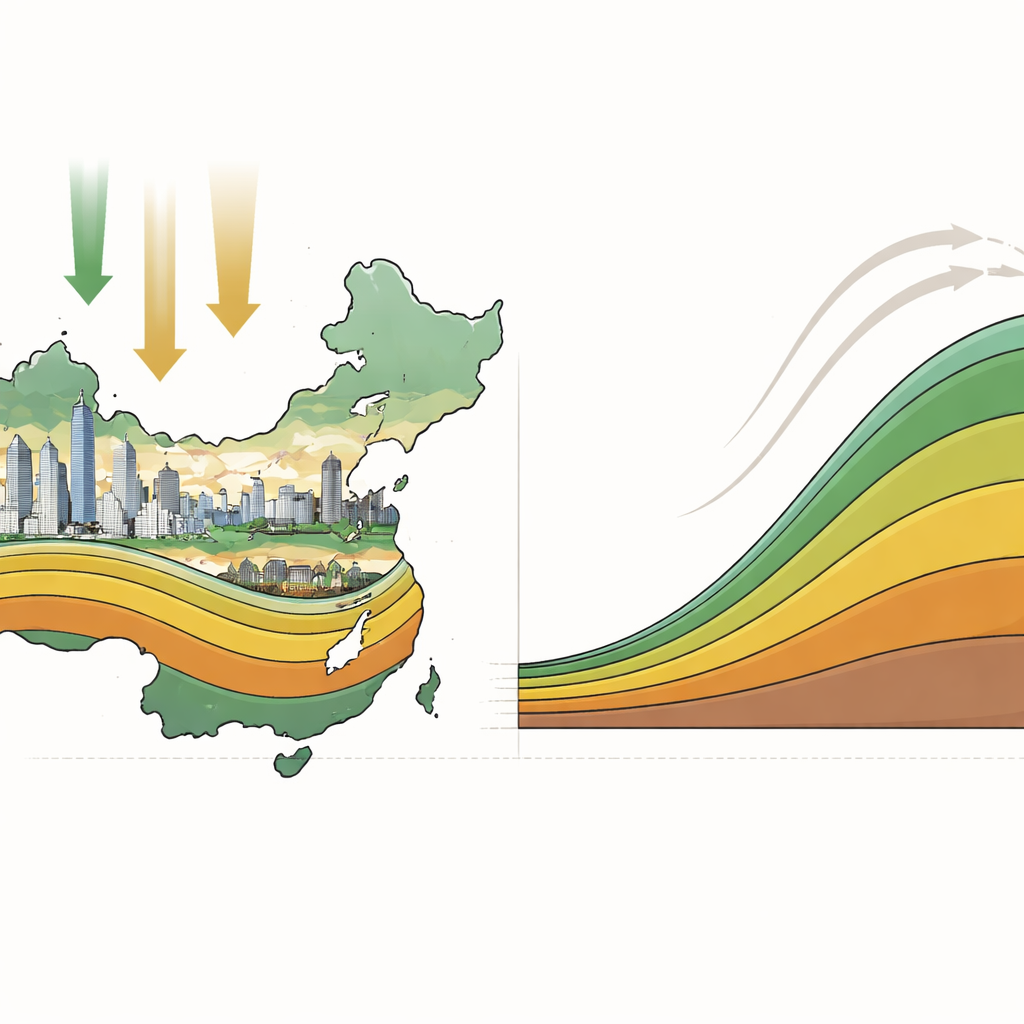
Taking stock of a growing nation
The authors extend an existing nationwide database, the Provincial Material Stocks and Flows Database (PMSFD), so that it now covers 45 years, from 1978 to 2023, across all 31 provinces in mainland China. They track 13 major materials—such as steel, aluminum, sand, gravel, brick, cement, glass, plastic, and wood—used in five everyday categories: buildings, infrastructure, vehicles and other transportation equipment, machinery, and domestic appliances. By combining official statistics with standardized engineering estimates of how much material goes into typical products, they reconstruct how much of each material has been added, how much has left use as waste or scrap, and how much remains locked in the country’s buildings and infrastructure each year.
How the numbers were built
Rather than starting from raw material extraction alone, the team works from the bottom up. They count real-world products—floor area of buildings, length of roads, number of vehicles and machines—and multiply these by typical material contents to calculate stocks, or the in‑use “inventory” of material in society. Then they use a lifetime model to estimate when these products reach the end of their useful lives and become outflows, such as demolished concrete or discarded appliances. Balancing the changes in stocks with these outflows reveals the annual inflows, or new material demand. Assumptions are needed where official data are scarce, especially for non‑residential buildings, and the researchers test how uncertainties in material content affect their results using large‑scale computer simulations. The overall uncertainty in national stock estimates remains small, generally below a few percent.
From breakneck growth to signs of slowing
The data reveal just how rapidly China’s built environment has expanded. Total material stocks rose nearly tenfold between 1978 and 2023, from about 21 billion to over 200 billion metric tons, with the average amount per person jumping from roughly 22 to more than 140 metric tons. Most of this weight is in non‑metallic materials: sand, gravel, and cement used for concrete and other construction make up more than four‑fifths of the total, while metals such as steel and aluminum, though vital, form only a small share by weight. Yet the pace of accumulation has clearly eased since 2019, and total stocks in 2023 were slightly lower than in 2022, suggesting that some parts of the country may have passed their peak building phase. 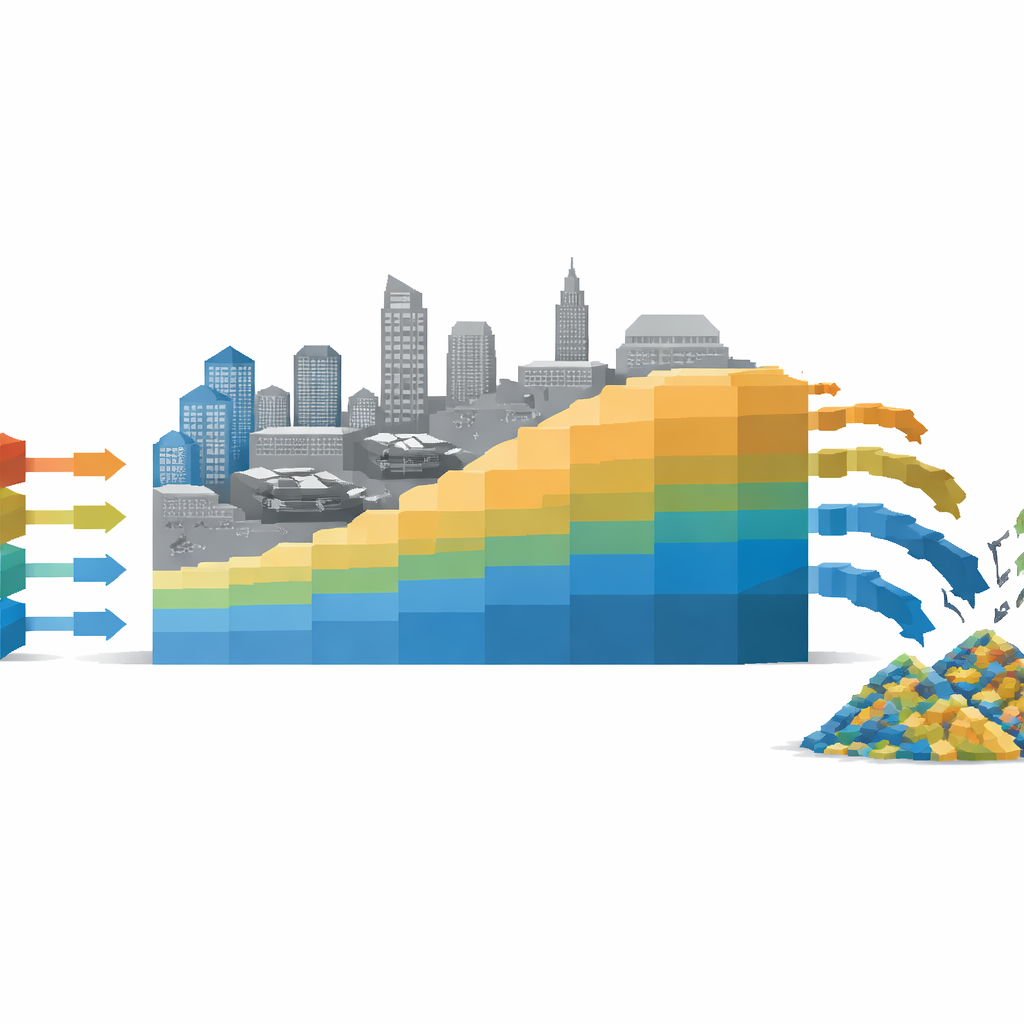
Uneven landscapes across provinces
The new database also highlights regional contrasts. Provinces in the booming southeast—Guangdong, Shandong, Jiangsu, and Zhejiang—hold the largest total and per‑person stocks, reflecting decades of industrialization and dense urban development. When the authors compare material stocks per person with income per person, they find an S‑shaped relationship: as economies grow, material stocks first rise quickly, then their growth slows once incomes pass around 20,000 yuan per person (in constant prices), and eventually levels off near 40,000 yuan. This pattern hints at a “saturation” of demand for new buildings and infrastructure, where prosperity no longer requires ever more concrete and steel. At the same time, material inflows peaked around 2019, while the flow of discarded material and scrap has continued to climb, especially in richer coastal provinces—signaling the arrival of a large wave of demolition waste and recyclable metals.
How this resource map can be used
Because it is open and consistent across provinces and years, the PMSFD offers a common reference point for many kinds of analysis. Researchers can use it to study how China’s economic transitions, urbanization policies, and climate goals affect material demand; to model future construction needs and demolition waste; to plan recycling and circular economy strategies; or to estimate the greenhouse gas emissions embodied in the country’s buildings and infrastructure. Policymakers can draw on these insights to align regional development with the national “dual‑carbon” targets of peaking and then neutralizing carbon emissions. While the authors note limitations—such as simplified assumptions about product lifetimes and average material contents—they see this database as a living resource that can be refined over time and replicated for other countries.
What it all means for a sustainable future
In everyday terms, this work shows that China’s era of simply adding more concrete, steel, and glass is beginning to give way to a new phase: maintaining and upgrading what already exists, while coping with a surge of aging buildings and infrastructure reaching the end of their lives. The updated database quantifies this turning point, province by province, making it possible to anticipate where future waste, recycling opportunities, and environmental pressures will emerge. For citizens, it underscores that sustainability is not just about how much we consume each year, but also about the massive physical legacy of past growth—and how wisely we manage that legacy from now on.
Citation: Huang, J., Huang, G., Song, L. et al. China material stocks and flows account for 2019–2023. Sci Data 13, 554 (2026). https://doi.org/10.1038/s41597-026-06903-2
Keywords: material stocks, China infrastructure, resource use, circular economy, sustainability transition