Clear Sky Science · en
Divergent latitude-specific urban humid heat risks are regulated by local climate types
Why steamy city heat matters
On hot summer days in cities, what you feel is not just the temperature on a weather app. It is the heavy mix of heat and humidity that makes it hard for sweat to evaporate, strains the heart and lungs, and can turn a warm afternoon into a dangerous health threat. This study looks at that muggy burden, called humid heat, in 56 major cities around the world over the past two decades to see where it is getting worse, why it differs by location, and what it means for the millions of people who live there.
Heat you can feel, not just read
Scientists use a measure called wet bulb temperature to capture how heat and humidity work together on the human body. Unlike ordinary air temperature, this measure tells us how easily we can cool ourselves by sweating. The researchers combined satellite observations, weather station data, and population maps to track how this measure has changed in cities between 2005 and 2024. They found a clear pattern with latitude: warm, humid tropical cities often sit at very high values year round, while polar cities stay far lower. Since 2020, both the average and the extremes of this sweaty type of heat have risen sharply worldwide, with record values in 2023 and 2024 that push some regions closer to the limits of human tolerance. 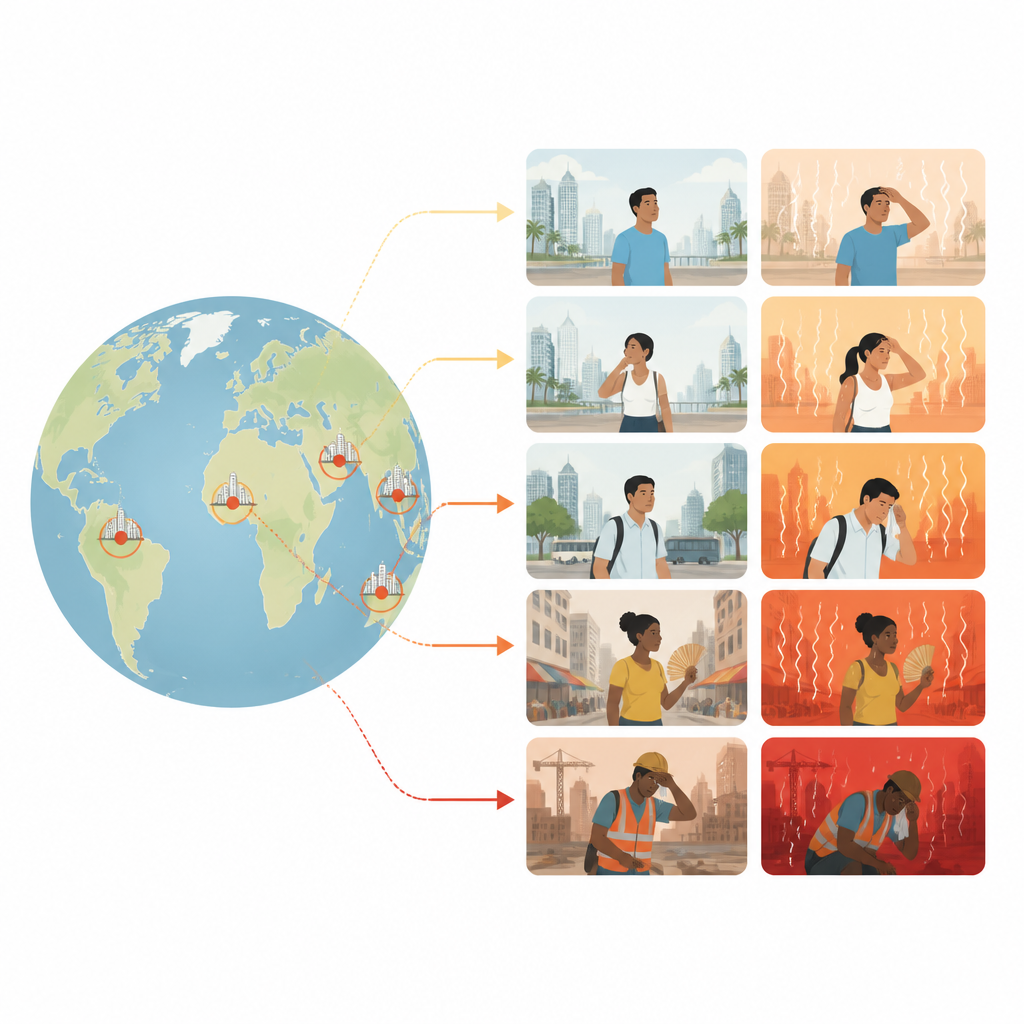
Cities that warm up in different ways
Not all cities heat up in the same fashion. Tropical coastal cities such as Jakarta, Manila, and Bangkok already sit in very moist air, so extra heat from buildings and pavement is partly softened by breezes from the ocean and abundant water vapor. Their wet bulb temperatures are high but relatively steady. Inland cities like Beijing, Delhi, or Cairo show stronger contrasts between downtown and surrounding countryside, with steep gradients from core to suburbs. Mid and low latitude metro areas such as Tokyo, Seoul, and Shanghai have especially patchy patterns, where some neighborhoods are much more oppressive than others. Overall, about 60 percent of the studied cities show clear urban warming in humid heat, while roughly 40 percent, often in dry regions, show the opposite pattern, with slightly cooler city centers thanks to irrigation, parks, or water bodies.
Local climate and city form shape the risk
The study shows that the background climate strongly steers how urban growth affects humid heat. In the tropics and subtropics, where the air is already moist, changes in water vapor play a large role. There, even small shifts in humidity can significantly raise the heat people feel, and urban development tends to boost wet bulb values. In cooler, drier climates at higher latitudes, wet bulb temperature responds more to changes in ordinary air temperature than to moisture. Paved surfaces, tall buildings, and reduced vegetation can either raise or, in some cases, slightly lower the humid heat compared with nearby rural areas, depending on how they alter wind, shade, and evaporation. Larger urban areas and higher population densities are linked to stronger urban–rural differences, while the exact shape of the city and patchy vegetation introduce more subtle effects. 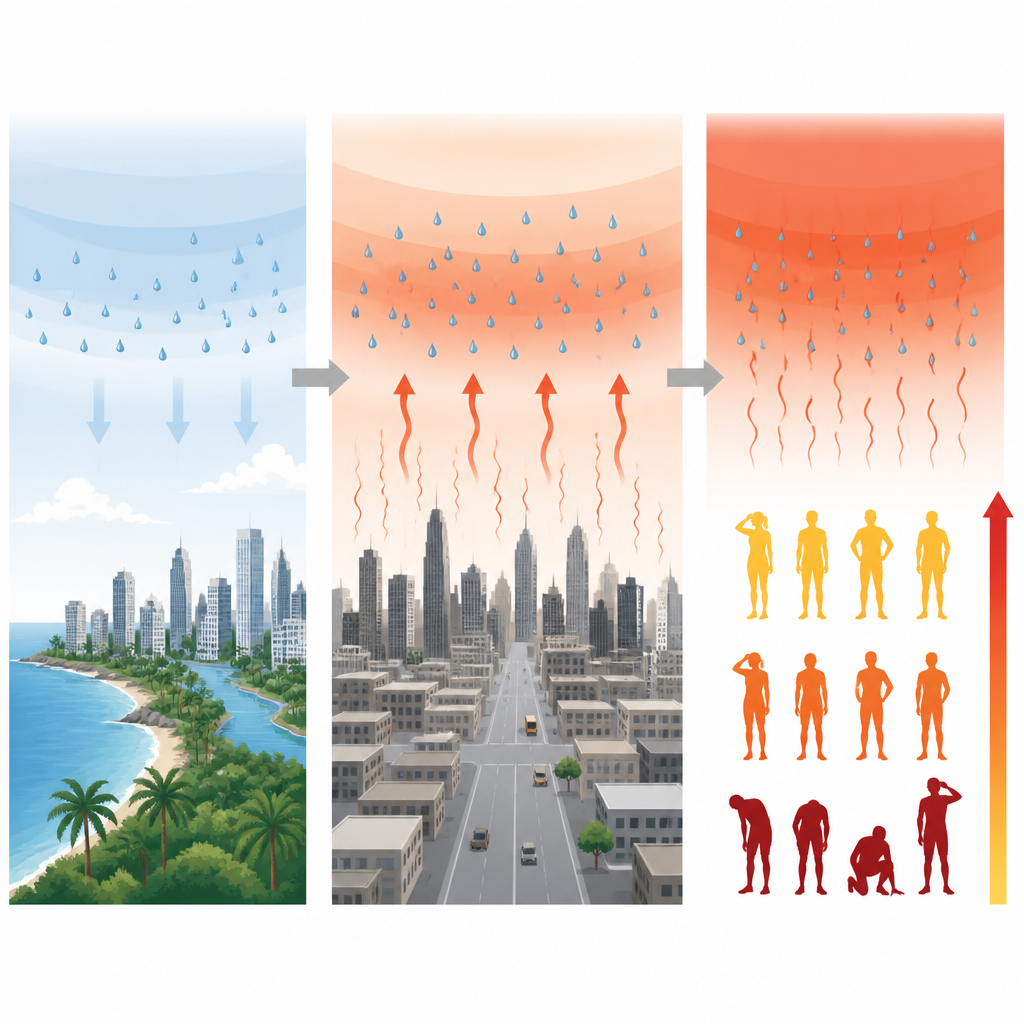
More frequent, longer, and harsher muggy spells
Beyond average conditions, the researchers examined humid heatwaves, defined by unusually high wet bulb temperatures for each location. They grouped these events into mild, moderate, severe, and extreme levels. Mild events, while still stressful, are now common in many cities from June through September and have become more frequent since about 2015. More intense events are rarer but increasingly clustered in midsummer, with the strongest jumps in 2023 and 2024. Those years saw the longest runs of humid heat, lasting up to about two weeks, and the largest build up of cumulative heat over time. When combined with detailed population data, the analysis shows that most people currently experience mild exposure, but the share of city dwellers facing moderate and higher levels is rising, and urban residents are consistently more exposed than rural ones.
What this means for people in cities
Taken together, the findings paint a clear picture: as the planet warms and cities expand, humid heat in urban areas is becoming more intense, more frequent, and more unevenly shared. Tropical coastal cities already live near the high end of what the human body can safely endure, while fast growing inland and mid latitude cities are seeing sharper jumps in oppressive conditions and greater exposure for their residents. Because wet bulb temperature closely tracks our ability to shed heat, these trends signal mounting health risks, especially for workers outdoors, older adults, and people without access to cooling. The study suggests that future planning must account for both heat and humidity, and must be tailored to local climate and city form, if urban areas are to remain livable in a warming world.
Citation: Xu, L., Zhang, Q., Tang, S. et al. Divergent latitude-specific urban humid heat risks are regulated by local climate types. Commun Earth Environ 7, 425 (2026). https://doi.org/10.1038/s43247-026-03437-8
Keywords: urban heat, humid heat, wet bulb temperature, climate change, heatwaves