Clear Sky Science · en
Charting cell-type-specific positive genetic interaction at single-cell resolution for lung adenocarcinoma
Why tiny differences between cells matter
Doctors know that two people with the “same” lung cancer can respond very differently to treatment. One reason is that a tumor is not a uniform lump, but a patchwork of many cell types—cancer cells in different states, immune cells that may fight or aid the tumor, and more. This study asks a simple but powerful question: can we read the patterns of how genes work together inside individual cells to tell which tumors are more dangerous and which patients are more likely to benefit from immunotherapy?
Looking inside tumors one cell at a time
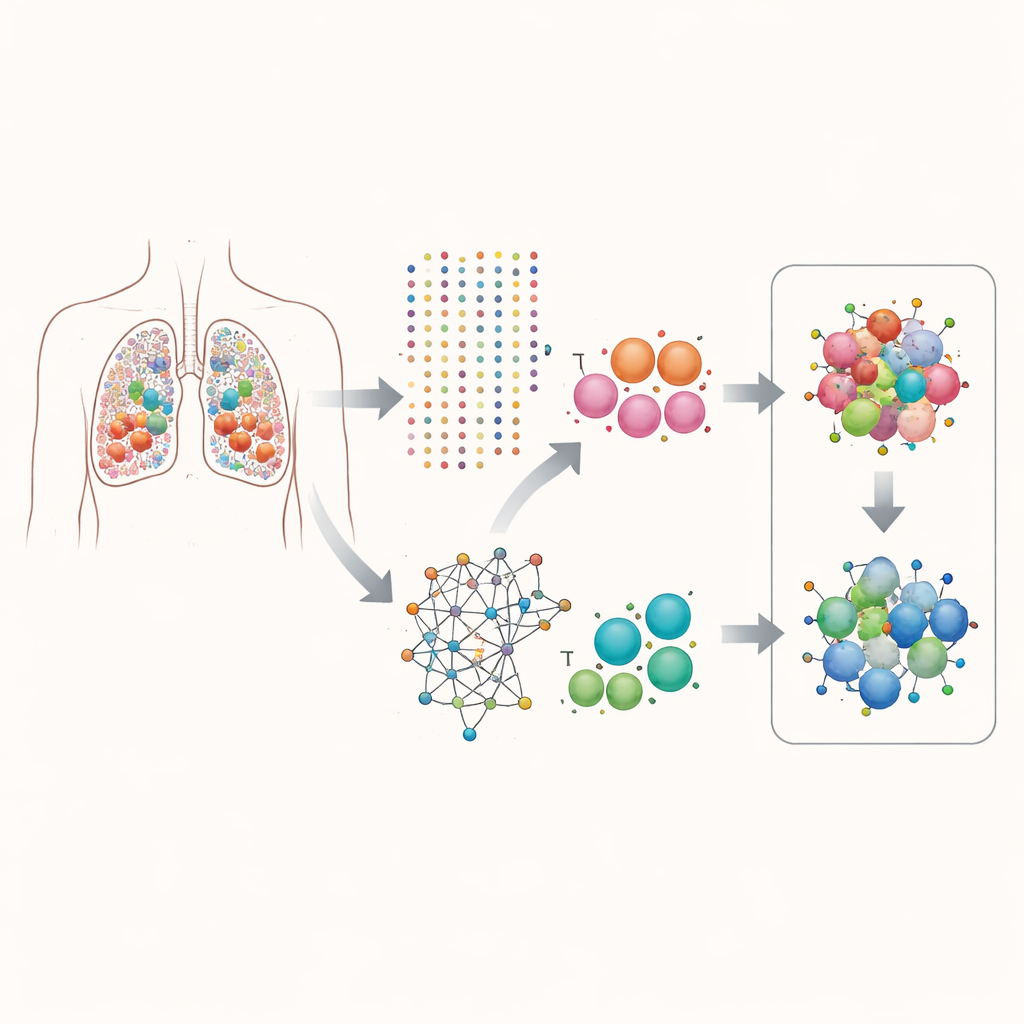
The researchers focused on lung adenocarcinoma, a common form of lung cancer. Using single-cell RNA sequencing, they measured which genes were turned on in over 160,000 individual cells taken from patient tumors. Instead of looking at average gene activity across the whole tumor, they separated the data by cell type, paying special attention to epithelial cells (the cells that become cancerous) and T cells (immune cells that can attack tumors). This cell-by-cell view let them ask which genes tend to be switched on together inside the same cell, and how those pairings relate to how fast the cells appear to be dividing.
Finding helpful gene partnerships
The team built a computational pipeline they call scPGI-finder to hunt for “positive genetic interactions” at single-cell resolution. In plain terms, they looked for gene pairs that are often jointly active in the same cell and whose joint activity is linked to higher cell fitness, measured by signatures of cell division and growth. After several filtering steps—checking how often each pair is co-active, whether those cells look more proliferative, whether the genes are strongly co-expressed, and whether they share similar biological roles—they assembled two large maps of gene–gene partnerships: about 50,000 pairs in epithelial cells and 16,000 in T cells. These interaction networks were tightly connected in known protein and pathway maps, suggesting they capture real cooperative programs rather than random coincidences.
Reading malignancy from cancer cells’ wiring
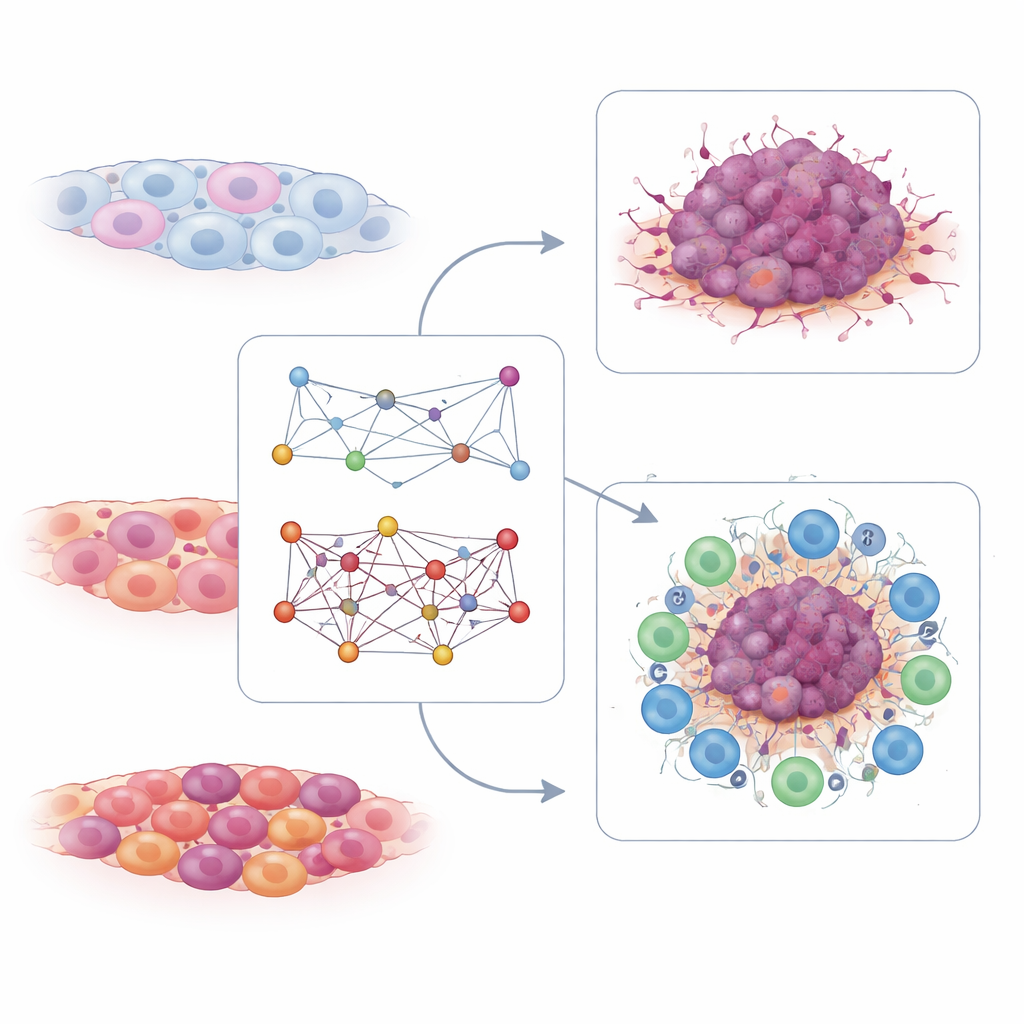
Among the epithelial interactions, the authors highlighted a subset that was much more strongly co-active in malignant cancer cells than in nearby non-malignant epithelial cells. They combined these into a score that reflects how many of these “malignant epithelial” gene pairs are jointly active in a given cell or tissue sample. Cancer cells with higher scores looked more stem-like, less differentiated, and more associated with classic cancer hallmarks such as uncontrolled growth. When applied to bulk tumor samples from many patient cohorts, this score was consistently higher in tumors than in adjacent normal lung and separated tumor from normal tissue with very high accuracy. Patients whose tumors had high scores tended to have poorer survival, and certain high-scoring cell lines were more sensitive to several drugs that target growth-driving signals, particularly drugs aimed at the EGFR pathway.
Reading immune strength from T cells
The T-cell interaction map told a complementary story. Here, the researchers searched for gene pairs whose joint activity in T cells was linked to good or poor responses to immune checkpoint therapy, a form of immunotherapy that unleashes T cells against cancer. They found hundreds of pairs connected to either responsiveness or resistance. From these, they distilled a small signature built from just six interaction pairs tied to T cell receptor signaling. In multiple independent patient datasets, higher values of this T-cell interaction score were seen in people who responded to PD-1–based immunotherapy and were linked to longer survival. Tumors with high T-cell scores tended to have a “hot” immune environment, rich in active immune cells, while low scores marked “cold” tumors less likely to benefit from these drugs.
What this means for future cancer care
This work shows that looking not only at which genes are turned on, but at how pairs of genes are co-activated within specific cell types, can reveal hidden structure in tumors. In lung adenocarcinoma, patterns of cooperative gene activity in cancer cells help flag more aggressive disease, while similar patterns in T cells help predict who will benefit from immunotherapy. Although these interaction maps are based on correlations rather than direct experiments, they provide a new way to read a tumor’s internal wiring from single-cell data and could guide more precise diagnosis, prognosis, and treatment choices as the approach is refined and extended to other cancers.
Citation: Chen, B., Liu, M., Dong, Q. et al. Charting cell-type-specific positive genetic interaction at single-cell resolution for lung adenocarcinoma. npj Precis. Onc. 10, 137 (2026). https://doi.org/10.1038/s41698-026-01328-x
Keywords: lung adenocarcinoma, single-cell genomics, genetic interactions, tumor microenvironment, immunotherapy response