Clear Sky Science · en
Global spatially detailed water footprint of crop production over five decades
Why our food’s hidden water use matters
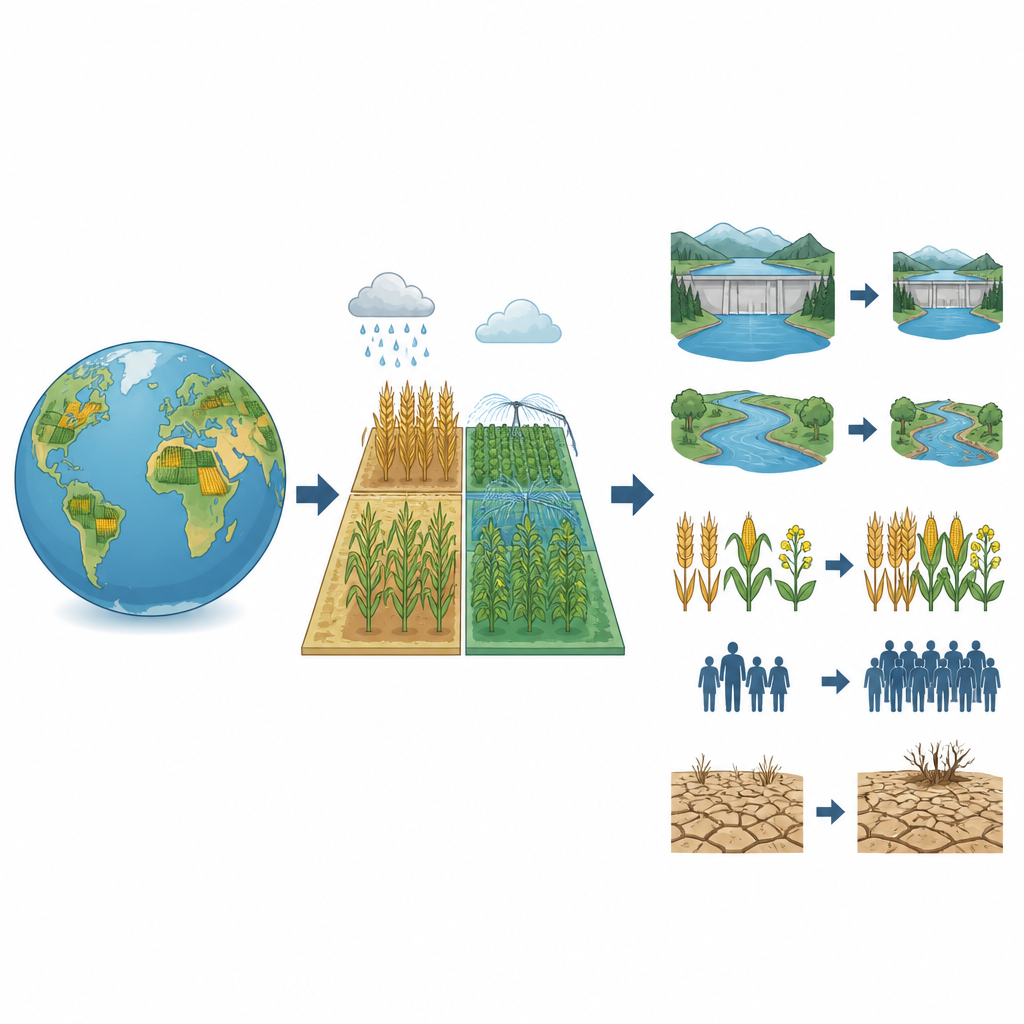
Every bite we eat carries a hidden story of water use. From rice paddies to palm oil plantations, crops pull from rain and irrigation to grow, quietly shaping rivers, aquifers, and future food security. This study tracks how the water used to grow crops worldwide has changed over the last five decades, revealing which foods, regions, and economic forces are driving rising pressure on limited freshwater supplies.
Following water in our fields
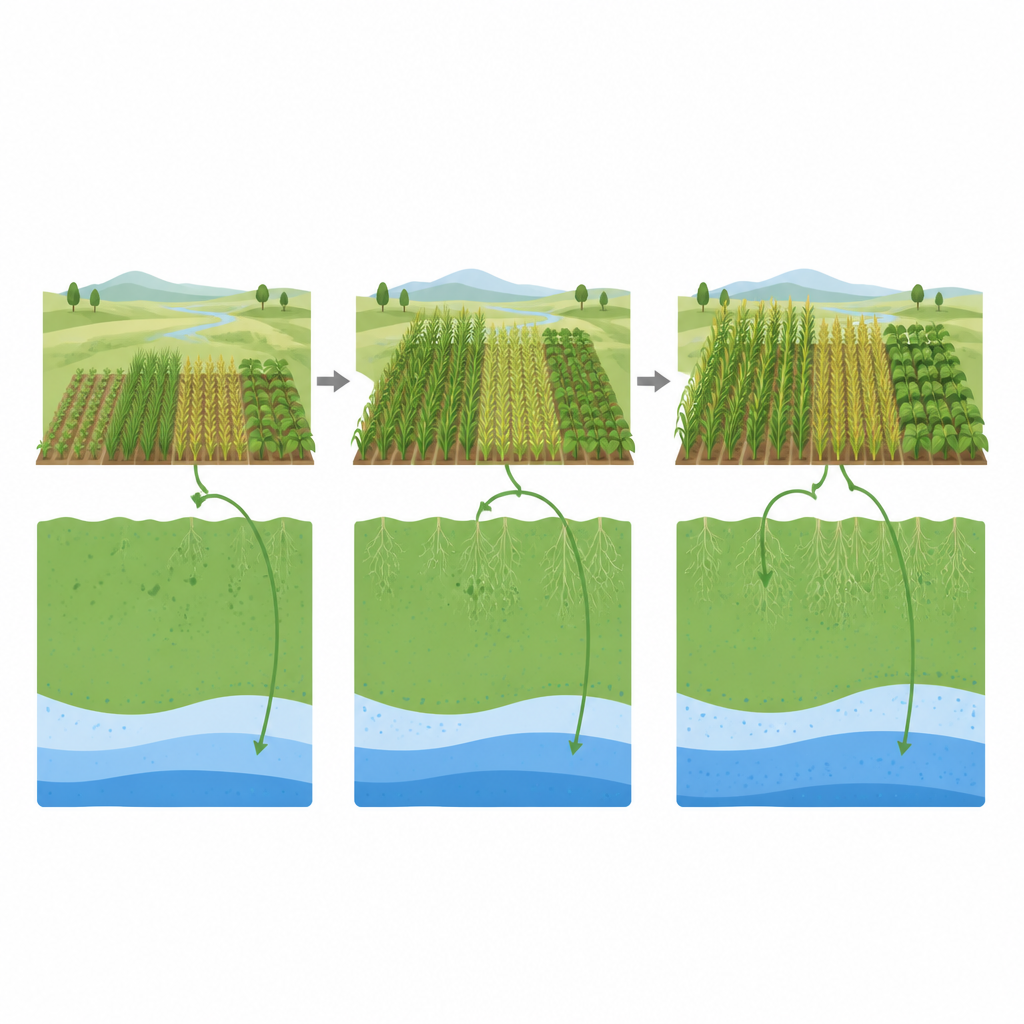
The researchers examined the “water footprint” of 168 crops around the globe from 1972 to 2018. Instead of looking only at national averages, they mapped crop water use on a fine global grid, separating water that comes from rainfall (green water) from water supplied through irrigation (blue water). Using detailed crop growth models and global data on harvested areas, they quantified how much water crops consumed each year, how efficiently that water was turned into harvests, and which crops were destined for food, animal feed, or products such as biofuels and cosmetics.
How crop water use has grown
Over the study period, the total water footprint of crop production rose by about 62 percent, from roughly 4,800 to 7,800 cubic kilometers per year. Green water has always dominated and still accounts for about 85 percent of crop water use, but both green and blue components increased by more than 60 percent. Most of this growth came from expanding cropland rather than thirstier climates. A 36 percent increase in crop area was responsible for the bulk of the rise, while higher yields kept the total from climbing even faster. Food for people remains the largest use, growing from 60 to 64 percent of crop water use, while water tied to animal feed and nonfood uses, especially biofuels and industrial crops, also climbed.
Crops and regions that drive demand
The biggest contributors to the rising water footprint were oil crops, cereals, and fruits. Oil crops alone explained about a third of the increase, led by soybeans and oil palm, whose harvested areas expanded dramatically, especially in tropical regions. Maize became the standout cereal driver, reflecting its growing role in animal feed, food, and ethanol. In contrast, traditional fiber crops saw their total water footprint fall as their harvested area shrank. Regionally, Africa more than doubled its crop water use and Asia increased by about 80 percent, together accounting for most of the global rise, driven by population growth and shifts toward more water-intensive diets. Europe was the only continent to slightly reduce its crop water footprint, mainly by improving water productivity and shifting toward less water-demanding crops.
Using water more efficiently
Although total crop water use increased, the water required to produce a ton of most crops fell over time. About four out of five crops became more water-efficient, with typical reductions in water per unit of harvest of around 25 to 30 percent. This improvement was mainly due to better yields, not lower evaporation. For example, maize and rice used slightly more water per field but produced far more grain, cutting their per-ton water footprint by about half. The study shows that without these yield gains, feeding today’s population at past productivity levels would have required much more land and nearly 80 percent more water than crops actually use now.
People and markets behind the numbers
To understand what is driving these changes, the authors linked their water maps with national data on population, income, livestock production, trade, and biofuel use. Statistical models point to population growth as the strongest driver of rising crop water footprints, followed by agricultural exports and the size of national economies. Growing incomes tend to increase consumption of meat, dairy, and processed foods, all of which require more crop water, even as richer countries often adopt more efficient farming techniques. Livestock and biofuel production also add to demand, and future expansion of biofuels could significantly boost pressure on water resources if not carefully managed.
What this means for our future food and water
For non-specialists, the message is clear: rising harvests have so far outpaced population and diet changes only because farmers around the world have grown more food per drop through better seeds, fertilizer, and irrigation. Yet total crop water use is still climbing, especially for oil crops and maize, and much of that growth is concentrated in regions already facing water stress and environmental damage from deforestation. The study suggests that keeping food systems within the planet’s water limits will require a mix of actions: further boosting yields where it is sustainable, protecting forests, expanding rainfed production where climates allow, and shifting diets and trade patterns toward foods that use less water.
Citation: Demeke, B.W., Mekonnen, M.M., Brauman, K.A. et al. Global spatially detailed water footprint of crop production over five decades. Sci Rep 16, 15976 (2026). https://doi.org/10.1038/s41598-026-46362-8
Keywords: water footprint, crop production, irrigation, global agriculture, green water