Clear Sky Science · en
Urban theft prediction via LLM-empowered spatiotemporal transformer
Why city dwellers should care
For anyone who lives, works, or shops in a big city, theft is more than a statistic; it shapes how safe we feel on streets, in stores, and on public transit. This study looks at New York City and asks a practical question: can we use modern artificial intelligence to tell, hour by hour and block by block, where theft is most likely to occur, without simply repeating old policing biases? The answer could help cities protect people and property while using limited police resources more carefully.
Where and when theft really clusters
The researchers begin by showing how unevenly theft is spread across New York. Using a fine grid laid over the city, they find that some small areas see hundreds of times more theft than others. About half of all theft cases are packed into a tiny fraction of city blocks, especially in dense commercial zones like Midtown Manhattan. Time of year and time of day also matter: warmer months, holiday shopping periods, and busy commuting hours all bring more people into the streets and stores, creating more chances for theft. Weather, lighting, and neighborhood type add further twists, with clear, dry nights in lively business districts standing out as especially risky moments.
Turning city life into data
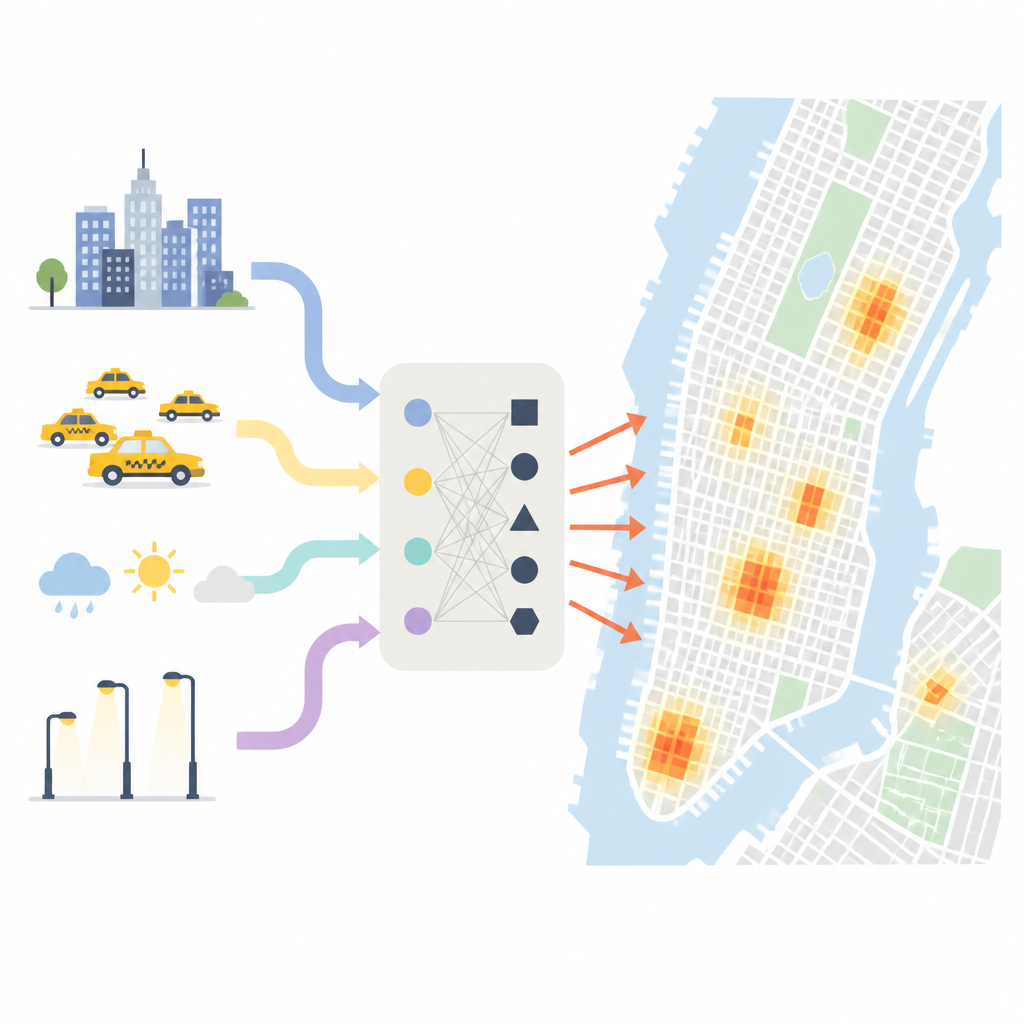
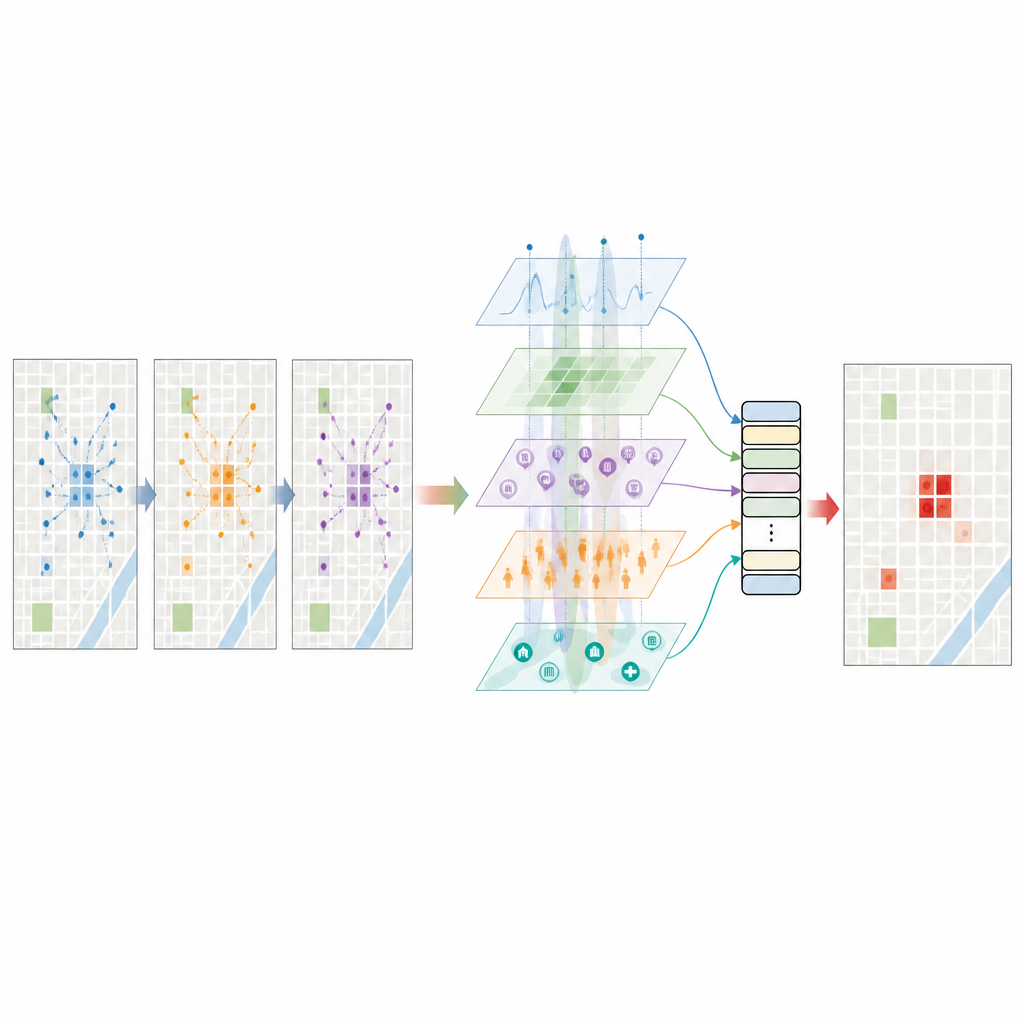
To capture this complex picture, the team combines five kinds of information. They use detailed police records of past thefts, hourly taxi pick-ups and drop-offs as a stand-in for how people move and gather, maps of stores, homes, parks, and transit stations, satellite images of night lights, and basic weather and census data. From this, they build dozens of indicators: how often crimes repeat in each grid cell, how crowded commercial zones get in the early evening, how theft risk in one block spills into its neighbors, and how crime rates rise or fall with shifts in rainfall or temperature. They also measure how long it has been since the last theft in each place, which turns out to be a strong clue to whether another one is likely soon.
Giving a language model a sense of the city
A key step is asking a large language model to read short, structured descriptions of each place and moment: where the block is, what kinds of venues it contains, how bright the night lights are, how many taxi passengers have just arrived, what the weather is like, and how often thefts have happened there before. The model then replies with an estimated theft risk and other semantic hints about how function, crowding, and time interact. These rich, text-based insights are turned into numerical vectors and carefully filtered so they do not just duplicate the structured data. The result is a high-dimensional portrait of each grid cell that reflects not only raw counts, but also patterns the language model has learned from a wide range of text about cities and crime.
How the prediction engine works
All of these features are fed into a spatiotemporal transformer model, a type of neural network designed to track patterns across both space and time. The model first brings different feature types onto the same footing, then applies attention mechanisms that learn which nearby blocks and which recent hours matter most for each prediction. It also uses the language model’s risk score as a prior belief and gently adjusts it using the observed data, so that neither side dominates. Trained on several years of New York data, the system predicts, for every grid cell and every hour, the chance that at least one theft will occur. In tests, it reaches a high level of discrimination between theft and non-theft situations and an F1 score that reflects a strong balance between catching genuine hotspots and avoiding false alarms.
What this means for everyday safety
To a layperson, the takeaway is that theft risk is not random; it is tightly bound to how people move through the city, how different areas are used, and how recent events have unfolded. By blending classic crime statistics with live-like signals such as taxi flows and night lights, plus the interpretive power of a language model, this approach can flag a small share of blocks and hours where much of the city’s theft actually occurs. While the method still needs testing in other cities and careful checks for fairness, it points toward tools that could help police and city planners focus on specific busy, high-risk zones at specific times, rather than casting a wide net over entire neighborhoods.
Citation: Tang, M., Wang, J., Bu, X. et al. Urban theft prediction via LLM-empowered spatiotemporal transformer. Sci Rep 16, 15525 (2026). https://doi.org/10.1038/s41598-026-45681-0
Keywords: urban crime prediction, theft hotspots, spatiotemporal modeling, dynamic population flow, large language models