Clear Sky Science · en
Time-lapse image analysis reveals trigger-dependent differences in ASC speck lifetime in the NLRP3 inflammasome
Why tiny sparks inside immune cells matter
When our bodies sense danger—such as crystals that cause gout, invading microbes or toxic compounds—immune cells switch on powerful alarm systems. One of these systems, called the NLRP3 inflammasome, helps launch inflammation to fight threats but can also drive disease if overactive. This study looks at tiny bright dots, or “specks,” that appear inside immune cells when this alarm is triggered. By watching these specks form and disappear over time, the researchers show that not all danger signals produce the same kind of inflammatory response, challenging the idea that this system behaves like a simple on–off switch.
A closer look at the cell’s internal alarm
Inflammasomes are molecular machines that assemble inside immune cells when they encounter harmful signals from outside the body (like bacterial toxins) or from within (such as uric acid crystals). Once assembled, they activate inflammatory messengers and a fiery form of cell death called pyroptosis. A hallmark of this process is the appearance of one or more bright specks made of a protein called ASC, which clump together with other inflammasome parts. Traditionally, scientists have measured this response using end-point tests on large cell populations—counting total specks or inflammatory molecules at a single time—making it hard to see what happens in any individual cell over hours.
Watching specks live, one cell at a time
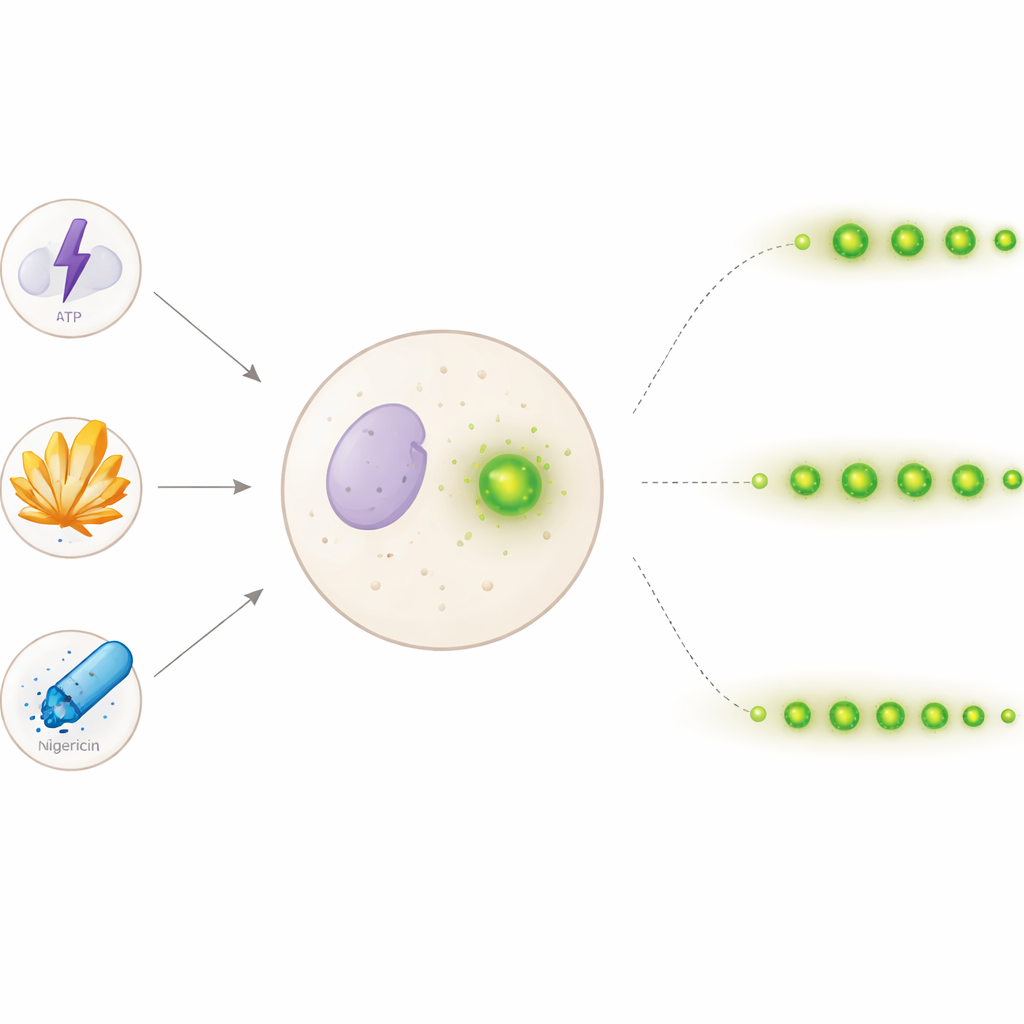
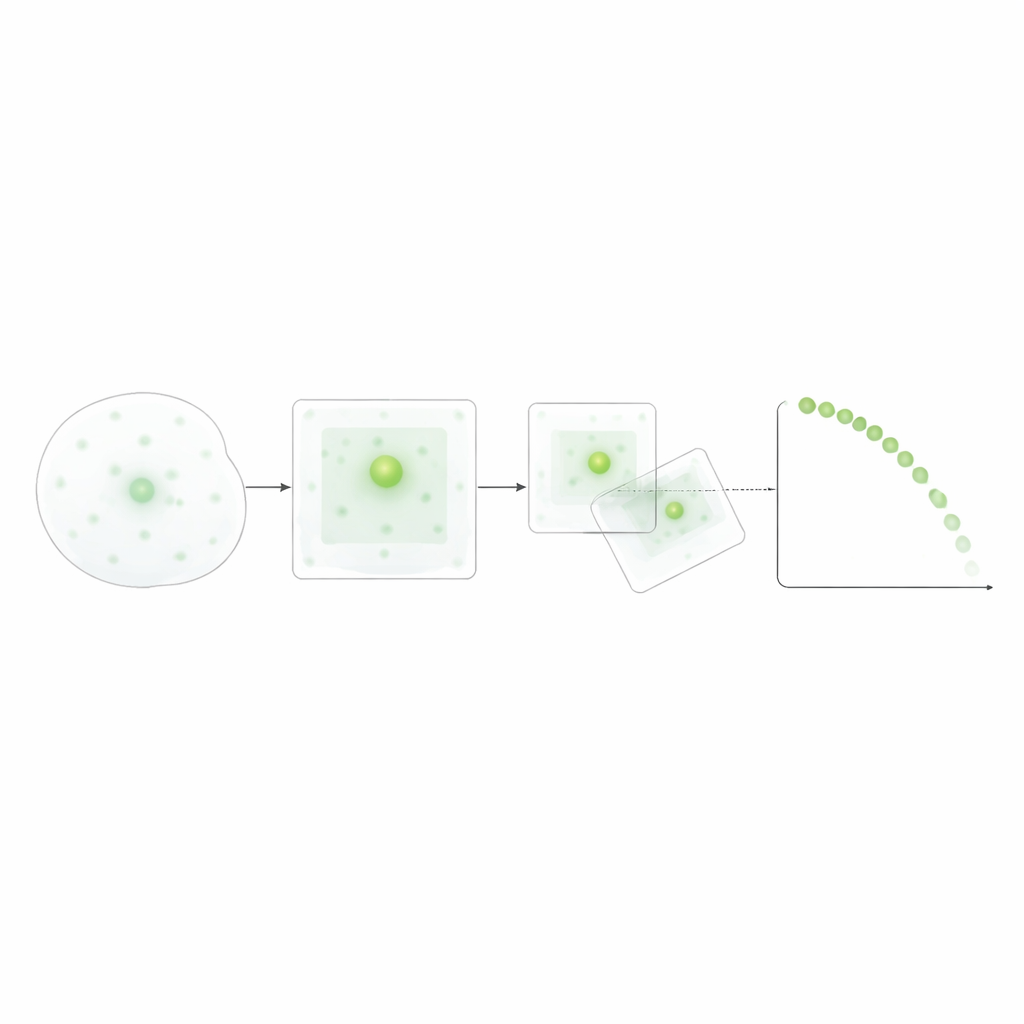
To get a more detailed view, the team used human immune-like cells engineered so that ASC glows green under the microscope. After “priming” the cells, they triggered inflammasome assembly with three common stimuli: ATP (a signaling molecule), sharp monosodium urate crystals (linked to gout), and the ion carrier nigericin (often used in lab studies). They then recorded images every 30 minutes for 24 hours. With thousands of images in hand, they built a step-by-step computer algorithm that could automatically spot round, bright specks and follow each one as it appeared, moved slightly, faded, or vanished. By comparing each speck in one image to the next, and using an adaptive search when signals grew dim, the program could estimate how long individual specks stayed visible—its “lifetime.”
Simple algorithms reveal complex behavior
Rather than relying on data-hungry deep learning, the researchers designed a transparent, rule-based method: thresholding the image, cleaning it with basic filters, and tracking the nearest neighboring speck between frames within a realistic movement range. They fine-tuned the brightness thresholds and movement limits using manual measurements to make sure the automated counts matched human judgment. Once validated, this approach allowed them to merge data across many microscopic fields and experiments, yielding distributions of speck lifetimes and formation times for each trigger. This relatively modest data requirement makes the method practical for standard lab setups, while still capturing the dynamic dance of specks at single-cell resolution.
Different triggers, different speck lifetimes
The lifetimes of these specks turned out to depend strongly on how the inflammasome was triggered. ATP produced many short-lived specks, with most disappearing quickly. In contrast, urate crystals and nigericin led to longer-lasting specks, and nigericin also drove the formation of a larger total number of specks. Statistical tests on lifetime distributions and survival-style curves confirmed that each trigger produced a distinct pattern: rapidly forming, shorter-lived specks for ATP; more slowly and continuously forming, longer-lived specks for urate crystals; and rapidly forming, long-lived specks for nigericin. Interestingly, when specks formed in time did not clearly predict how long they would last, suggesting that lifetime is shaped more by the nature of the trigger than by when the speck appears.
What these tiny specks may mean for health
The study shows that the specks marking inflammasome activity are not all equivalent; their number and how long they persist vary with the type of danger signal. This implies that the same molecular alarm can be tuned to respond differently to ATP, crystals, or ionophores, potentially leading to distinct inflammatory outcomes in health and disease. Just as important, the work demonstrates that careful time-lapse imaging plus a straightforward analysis pipeline can uncover this hidden diversity without vast datasets or complex artificial intelligence. In the long run, understanding how speck lifetimes relate to beneficial versus harmful inflammation could help refine therapies for conditions ranging from gout to chronic inflammatory and autoimmune disorders.
Citation: Herring, M., Persson, A., Karlsson, R. et al. Time-lapse image analysis reveals trigger-dependent differences in ASC speck lifetime in the NLRP3 inflammasome. Sci Rep 16, 14173 (2026). https://doi.org/10.1038/s41598-026-50936-x
Keywords: inflammasome, ASC speck, single-cell imaging, inflammation, cell death