Clear Sky Science · en
Availability of drone mission with binary decision diagram based on uncertain data
Why this matters for real-world drone missions
Drones are increasingly trusted with serious jobs: surveying forests for fire risk, checking bridges for cracks, or flying over disaster zones when it’s too dangerous for people. But mission planners often have to make go/no-go decisions based on incomplete or fuzzy information rather than hard statistics. This paper presents a way to turn that uncertain, expert-based knowledge into clear, numerical estimates of how likely a drone mission is to succeed, helping operators plan safer and more reliable operations.
From flight path to a logical mission map
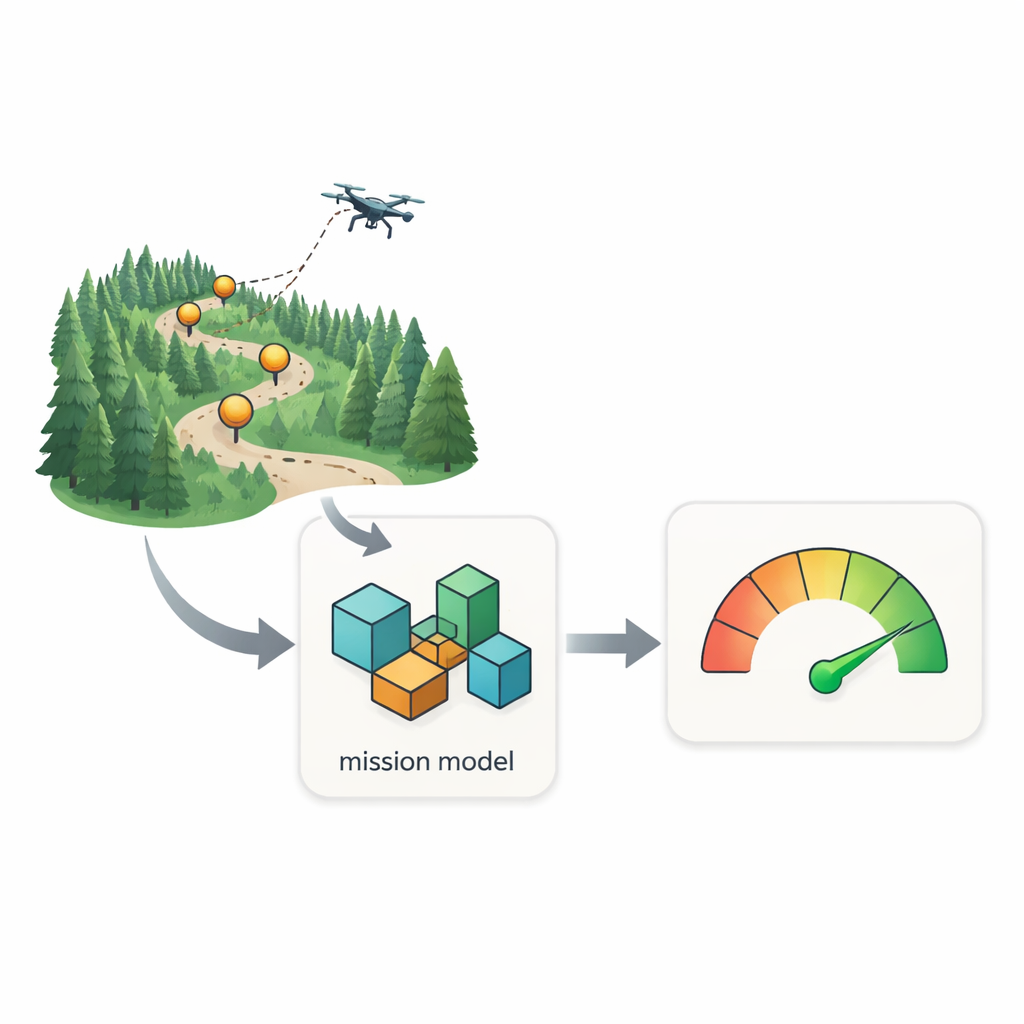
The authors start by treating a drone mission not just as a single aircraft in the sky, but as a system made up of many checkpoints along its route. Each checkpoint represents a place where the drone must gather useful data, such as images of a forest section. If key checkpoints fail, the mission fails, even if the drone itself stays in the air. This idea is captured in a “structure function” that maps combinations of successful and failed checkpoints to an overall judgment: mission success or mission failure. Instead of needing years of detailed statistics, this map can be built from expert opinions about how crucial each checkpoint is and how good the collected data tends to be.
Turning fuzzy expert opinions into a crisp model
In practice, expert assessments are rarely black and white. An operator might say that data from a checkpoint is probably usable, but with some uncertainty. The method embraces this fuzziness by using a fuzzy decision tree. For each recorded mission attempt, experts provide confidence levels that a checkpoint worked (value 1) or did not (value 0), and similar confidence levels for whether the mission outcome was useful. The fuzzy decision tree learns patterns from these soft, graded inputs, identifying which checkpoints matter most and how different combinations lead to success or failure. A defuzzification step then converts the fuzzy tree into a crisp, yes-or-no decision structure suitable for calculation.
A compact diagram that reveals mission weak spots
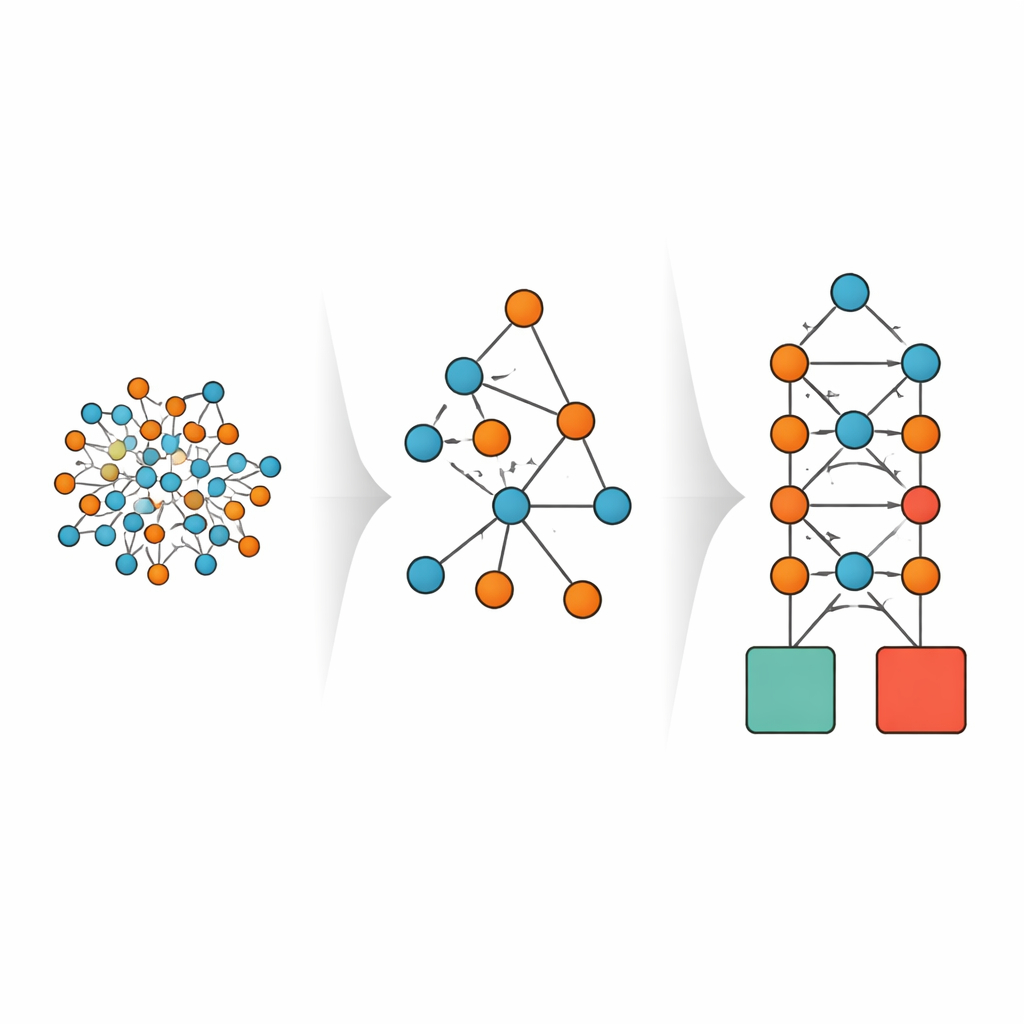
Once the decision tree is crisp, it is transformed into a binary decision diagram, a compact flow-like graph that encodes all the logical rules behind mission success. Each non-terminal node represents a checkpoint, and paths through the graph correspond to different ways a mission can succeed or fail. Because this representation avoids repeating identical substructures, it remains efficient even for missions with many checkpoints. With probabilities for each checkpoint’s success—again based on expert confidence or limited observations—the diagram allows the mission’s availability, or chance of success at a given moment, to be computed by summing the probabilities of all successful paths through the graph.
Forest fire monitoring as a test case
To show the method in action, the authors analyze a drone mission that monitors forest fire risk using eight checkpoints. Instead of all 256 possible combinations of checkpoint states, only 150 were available from expert evaluations—a little over half of the full set. Even so, the resulting binary decision diagram predicted mission outcomes with 94% accuracy on a separate validation set. The calculated mission availability was very high (about 0.992), but the model also revealed that the first checkpoint was a “bottleneck”: if it failed, the mission almost always failed. Simulated improvements to this and another sensitive checkpoint raised availability even further, demonstrating how the model can guide targeted upgrades or redesigns.
Strengths, limits, and future directions
The proposed framework is powerful because it stitches together well-known tools—fuzzy decision trees and binary decision diagrams—into a pipeline that works despite vague, incomplete data. It scales much better than alternative machine-learning approaches that would require explicitly enumerating every possible combination of checkpoint outcomes, which rapidly becomes impractical. At the same time, the method depends on the quality and consistency of expert judgments, and it currently focuses on a static view of missions rather than time-varying failures or repairs. The authors outline future work to incorporate mission duration, redundancy among multiple drones, and more advanced risk-aware decision-making for autonomous aerospace systems.
What this means for non-experts
In plain terms, this study offers drone operators and planners a way to answer a simple but crucial question: “Given what we think we know, how likely is this mission to work?” Even when data are patchy and based largely on expert experience, the method produces a transparent, inspectable logic model and a concrete success probability. It highlights which parts of a mission deserve the most attention, whether that means improving sensors at a specific checkpoint, adjusting the route, or adding a second drone. As drones take on more responsibility in monitoring, inspection, and emergency response, such tools can help ensure that their missions are not only ambitious but also demonstrably reliable.
Citation: Zaitseva, E., Rabcan, J., Levashenko, V. et al. Availability of drone mission with binary decision diagram based on uncertain data. Sci Rep 16, 13721 (2026). https://doi.org/10.1038/s41598-026-42988-w
Keywords: drone mission reliability, uncertain data, fuzzy decision trees, binary decision diagrams, forest fire monitoring