Clear Sky Science · en
Center-of-gravity shift and inequality of human water use in China over the last half century
Why this matters for everyday life
China’s dramatic rise over the past half-century has been powered by water—feeding its people, cooling its factories, and supplying its cities. Yet water is not where most people live, and moving it is costly for rivers, aquifers, and ecosystems. This study tracks how the “center of gravity” of China’s water use has shifted across the map since the late 1960s, and how fairly that water is shared among people. Understanding these long-term patterns offers clues for avoiding water crises, not just in China but in other fast-changing countries.
Following water’s shifting center
The researchers assembled a uniquely detailed record of how much water was withdrawn for farming, industry, and households in 340 prefectures across China from 1966 to 2020. They then calculated a kind of balance point on the map—the center of gravity of water use—much like finding the point where a tray would balance on your finger. Repeating this over time revealed how the balance point moved as the country’s farms, factories, and cities grew and shifted. They also examined how much each economic sector and each region contributed to these movements.
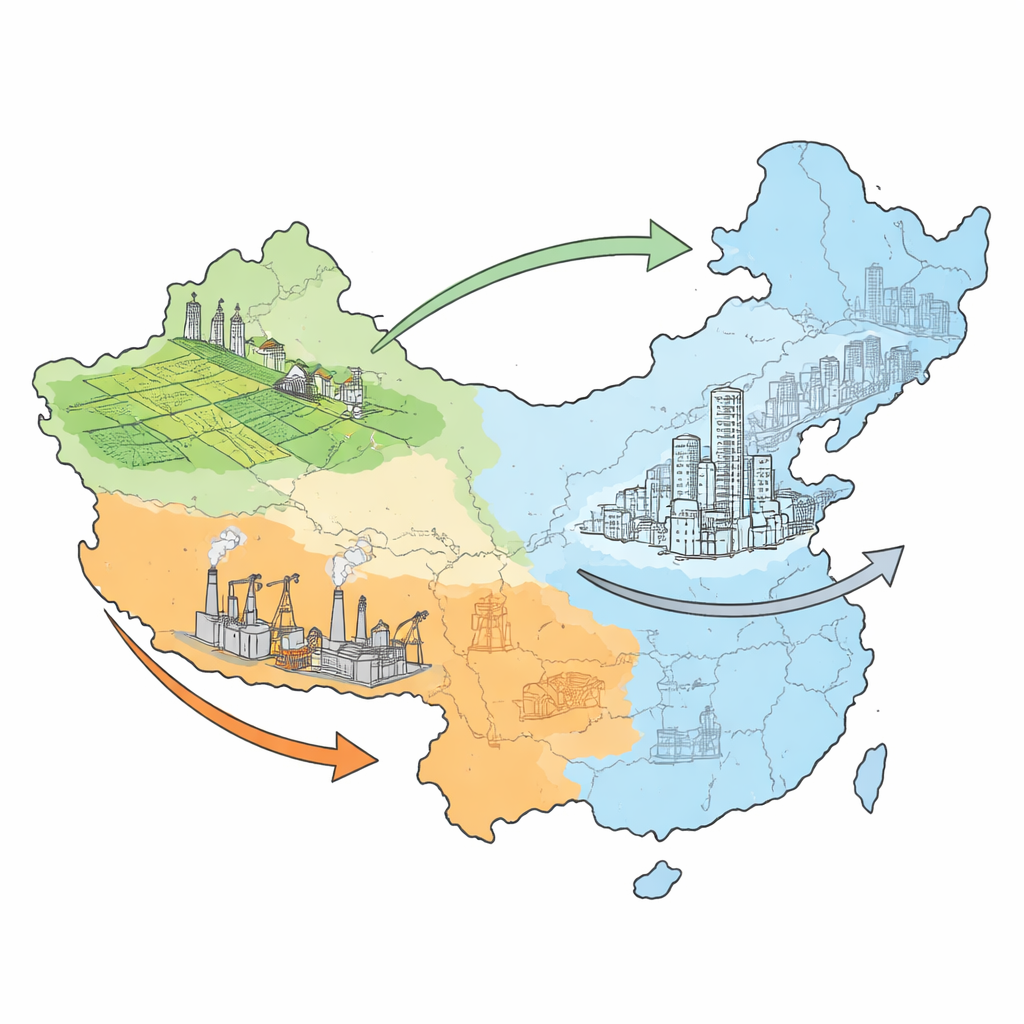
Farms move north, factories move south
The picture that emerges is one of strong but opposing shifts. Irrigation water, which is used to grow crops, marched roughly 336 kilometers toward the northeast, reflecting the rapid expansion of irrigated farmland and grain production in northern and northeastern China. Industrial water use, by contrast, migrated more than 1,000 kilometers toward the southwest as factories and heavy industry spread into southern regions. Household water use moved very little. Because the farm and factory shifts pulled in opposite directions, the balance point for total human water use barely moved—only about 134 kilometers northeast over five decades—even though overall withdrawals rose and then leveled off.
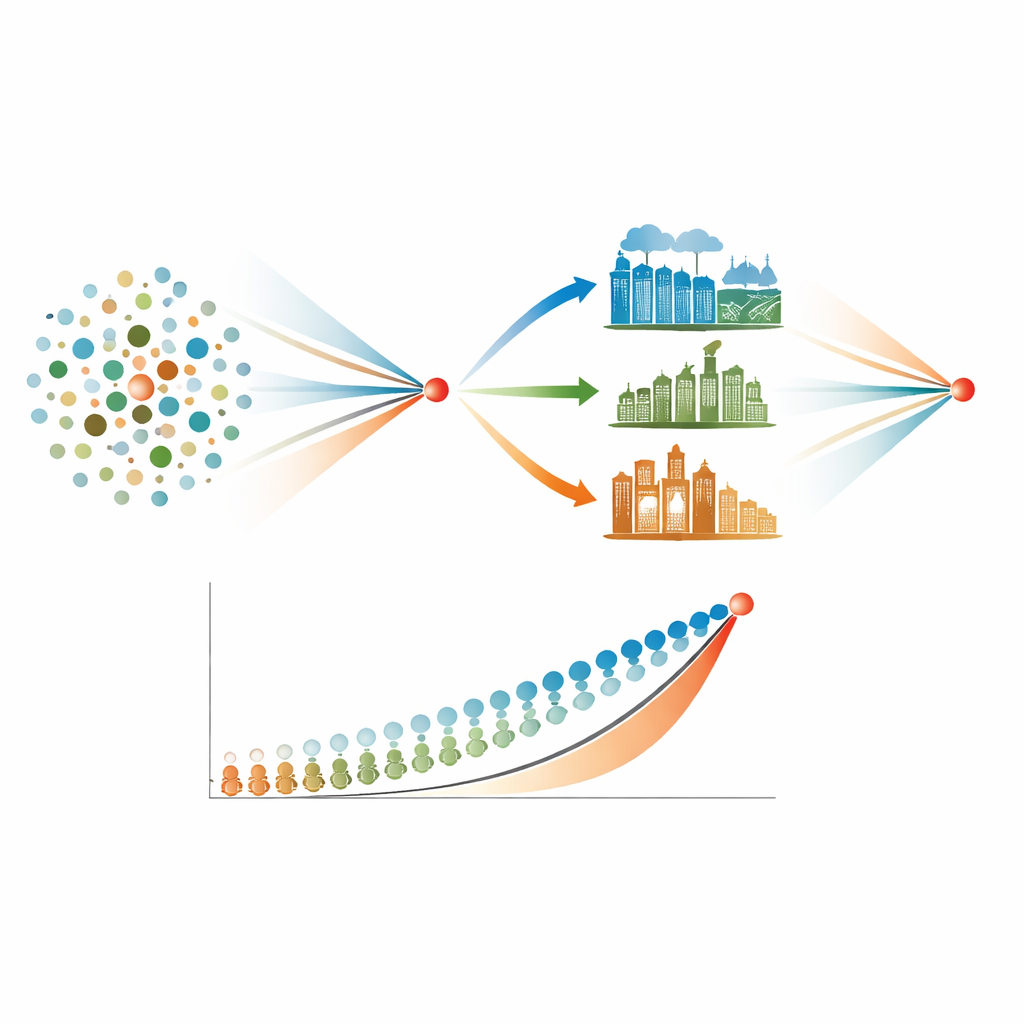
Scale versus efficiency in shaping the map
To understand what lay behind these shifts, the authors separated changes in how much land was irrigated, how large the industrial economy became, and how many people lived in each place from changes in how efficiently each drop of water was used. For irrigation, the spread of irrigated land in the north was the main force pulling the water-use center northeast, while improvements in how much water was used per hectare partly pulled it back. In industry, larger and more numerous factories in the south dragged the industrial water center southwest, while rising efficiency nudged it in the opposite direction. In all cases, changes in scale—more fields, more factories, more people—mattered more than gains in efficiency for where water was actually being taken from rivers and aquifers.
Who gets how much water?
Beyond where water is used, the study asked how evenly it is shared among people. Using the Gini coefficient—a standard measure of inequality—the authors found that inequality in total water use per person across China’s prefectures fell from high to moderate levels between 1970 and 2000 and has since held roughly steady. Industrial water use has always been the most uneven, reflecting how factories cluster in certain hubs, but its inequality has gradually declined. Irrigation shows moderate to high inequality, dropping until 2000 and edging upward afterward, while household water use is relatively even and has become more so over time, consistent with efforts to secure basic water access nationwide.
Regional gaps and policy signals
When the team broke down the numbers, they found that most of the inequality in water use comes from differences between provinces rather than from variations within them. Irrigation dominates these disparities because it still accounts for the largest share of withdrawals, and rapidly expanding irrigated areas in the dry northwest and northeast create hotspots where water use per person greatly exceeds the national average. At the same time, some prefectures with low water use support many people, indicating potential vulnerability. The analysis also shows that using only coarse, province-level data can significantly understate how unequal water use really is, highlighting the importance of fine-scale records for planning.
What it all means for the future
Put simply, the study shows that China’s water use has become somewhat more balanced among its people, but strong regional contrasts remain, driven mainly by where irrigated farming and industry have taken root. Shifting farms north has strained limited water resources there, while shifting factories south raises new concerns about water quality. Because big engineering projects that physically move water are reaching their limits, the authors argue that future solutions must also rely on changing what is produced where—using trade in “virtual water” embodied in food and goods, and improving efficiency in the places that use the most. Their map-based approach offers a way for decision-makers to see where water use and people are out of balance, and to steer policies toward a fairer and more sustainable sharing of this crucial resource.
Citation: Zhao, Y., Ma, Q. & Jia, J. Center-of-gravity shift and inequality of human water use in China over the last half century. Sci Rep 16, 11926 (2026). https://doi.org/10.1038/s41598-026-42569-x
Keywords: water use, China, irrigation, water inequality, spatial dynamics