Clear Sky Science · en
Multimodal imaging biomarkers associated with recurrence of diabetic macular edema during aflibercept treat-and-extend therapy
Why this matters for people with diabetes
Many people with diabetes worry about losing vision as damage quietly builds up in the back of the eye. This study looks at how to better predict which patients with diabetic macular swelling will stay dry and stable on fewer eye injections, and which are likely to have the swelling return. By combining several advanced eye scans, the researchers show that tiny changes in damaged retinal blood vessels can help doctors personalize treatment and reduce the burden of frequent visits.
Swelling in the seeing center of the eye
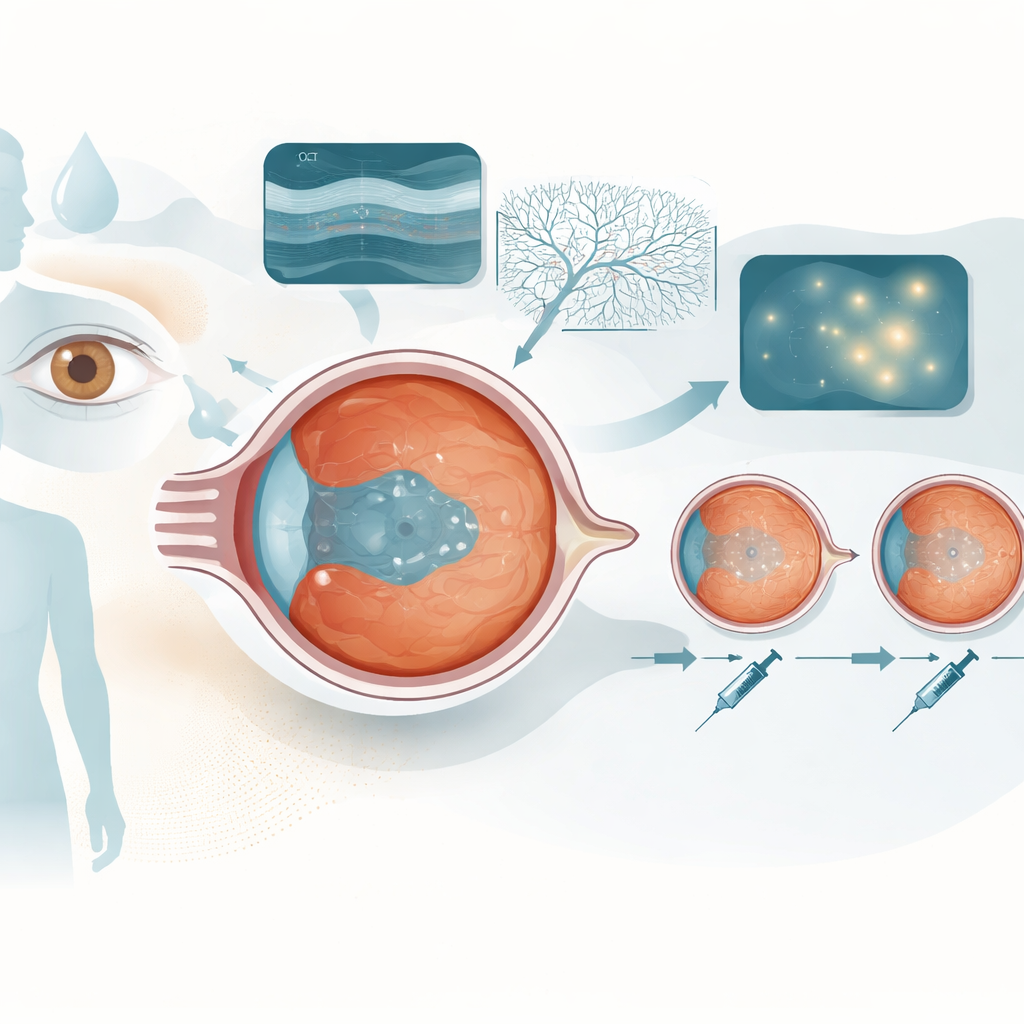
Diabetic macular edema is a build-up of fluid in the macula, the part of the retina that gives us sharp central vision. High blood sugar and inflammation weaken the small blood vessels in the eye, causing them to leak. Fluid, tiny bulges in vessels (microaneurysms), and abnormal new channels disrupt the normal layers of the retina and blur sight. Modern drugs that block a leakage‑promoting signal called VEGF, such as aflibercept, can dry out the macula, but people respond differently: some stay dry for months between injections, while others quickly become swollen again.
A flexible injection schedule guided by eye scans
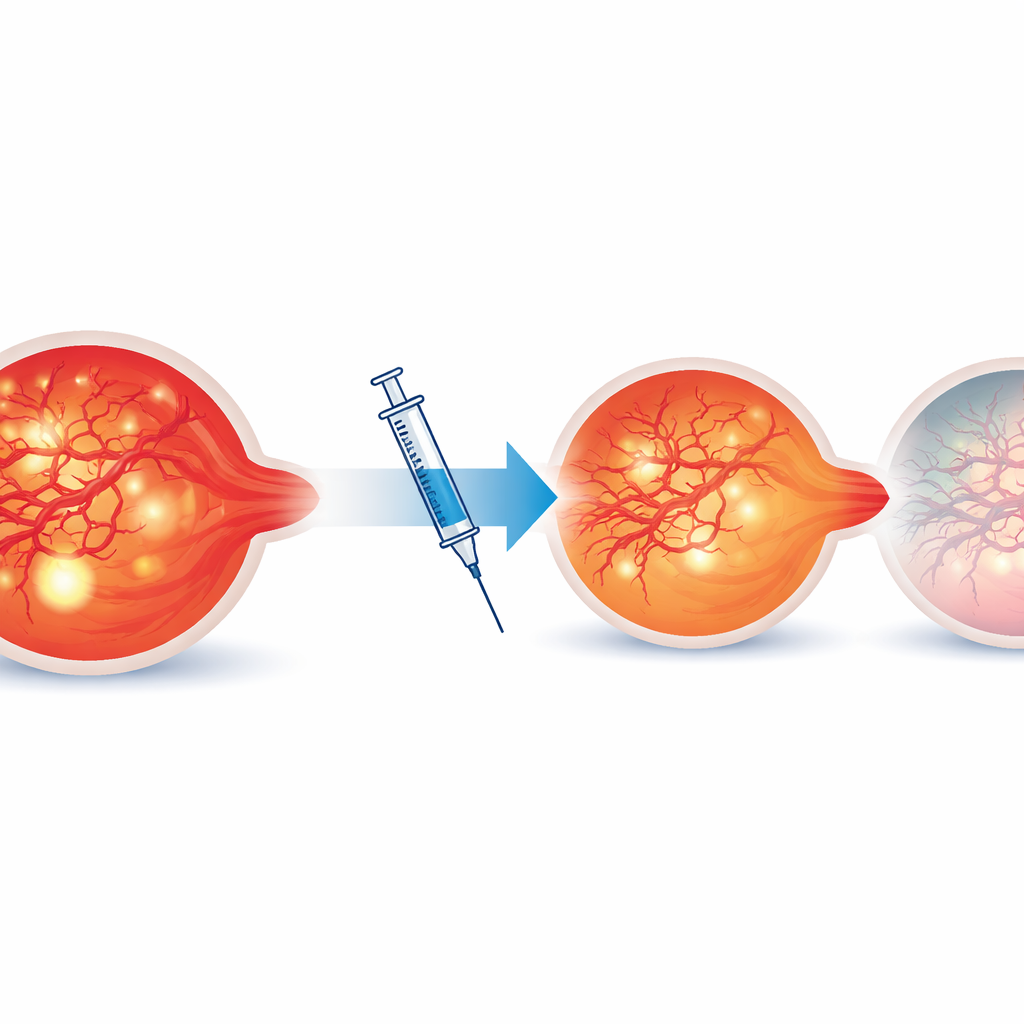
The team followed 28 eyes with center‑involving diabetic macular edema for 18 months. Everyone first received five monthly aflibercept injections to aggressively dry the retina. After that, they entered a “treat‑and‑extend” phase: if the macula stayed dry and vision stable, the interval between injections was gradually lengthened up to 16 weeks; if swelling or vision loss returned, the interval was shortened back to every 8 weeks. Throughout the study, patients underwent several types of imaging: standard cross‑section scans (OCT), dye‑based vessel imaging (fluorescein angiography), and dye‑free blood‑flow maps (OCT angiography).
Reading the eye’s warning signs
From these scans, the researchers tracked several potential “biomarkers.” On OCT, they counted tiny bright specks called hyperreflective foci, thought to reflect inflammation or fat‑laden cells, and measured the choroidal vascular index, which describes how much of the deep vascular layer is filled with blood versus supporting tissue. On fluorescein angiography, they measured how large an area of the macula was leaking and how many microaneurysms were present. On OCT angiography, they focused on intraretinal microvascular abnormalities (IRMAs)—twisted, dilated vessels that appear when parts of the retina are starved of oxygen. They then compared how these features changed in three outcome groups: eyes that needed shorter intervals, eyes that reached the longest interval, and a subgroup that stayed completely dry.
Which changes signaled lasting dryness?
Overall, vision improved and retinal thickness decreased after aflibercept, but the details revealed who did best. Eyes that remained completely dry showed marked reductions in bright inflammatory specks, leakage area (about 84% less), and microaneurysm counts (nearly 58% less). Most of these eyes had only minimal residual leakage by the end of the study, whereas persistent leakage was common in eyes that could not maintain longer intervals. The most striking finding came from OCT angiography: abnormal IRMA vessels regressed in 75% of lesions in the completely dry group, compared with just 10% in eyes that needed shorter intervals. Statistical modeling showed that IRMA regression was a strong predictor that an eye could safely move to longer gaps between injections.
Bringing it all together for personalized care
To a layperson, the main message is that careful, multimodal imaging can reveal whether the eye is truly stabilizing beneath the surface. Eyes in which leaky, abnormal vessels shrink back and blood flow patterns normalize after treatment are far more likely to stay dry on fewer injections. In contrast, eyes that retain many abnormal vessels and leakage, even if vision initially improves, are more likely to need frequent therapy. By paying attention to these subtle imaging clues—especially the behavior of IRMAs on OCT angiography—doctors may be able to tailor treat‑and‑extend schedules, sparing some patients unnecessary injections while ensuring others get timely care to protect their sight.
Citation: Kim, K., Lee, J., Choi, J. et al. Multimodal imaging biomarkers associated with recurrence of diabetic macular edema during aflibercept treat-and-extend therapy. Sci Rep 16, 12639 (2026). https://doi.org/10.1038/s41598-026-42342-0
Keywords: diabetic macular edema, aflibercept, retinal imaging, optical coherence tomography angiography, treat and extend regimen