Clear Sky Science · en
Mapping mismanaged plastic waste in Indonesia: subdistrict-level analysis through material flow from sources to the environment
Why everyday plastic in Indonesia matters to all of us
Plastic packaging, bags, and bottles help move goods and keep food fresh, but once we toss them away they do not simply vanish. In Indonesia, a vast island nation with more than 270 million people, discarded plastic can end up burned in backyards, piled on open ground, or swept into rivers that carry it toward the sea. This study asks a basic yet crucial question: where, exactly, does all that plastic go, and which local areas contribute most to the problem? By mapping plastic waste flows at a very fine scale, the authors offer a clearer picture of how everyday habits and uneven waste services combine to create pollution hotspots—and where action would make the biggest difference.
Following plastic from homes to the wider world
The researchers built a detailed “material flow” picture of plastic waste across Indonesia, tracking it from households and businesses through collection, dumping, burning, and leakage to the environment. Instead of relying only on national averages, they combined several rich datasets: a national waste information system, a large health and behavior survey, records on waste facilities, and population maps. Using geographic information systems, they broke the country down into more than 7,000 subdistricts, separating rural, semi-urban, and urban areas. They then used Monte Carlo simulations—repeated calculations that incorporate uncertainty—to estimate how much plastic is generated and where it ends up, while also grading the quality of the underlying data. 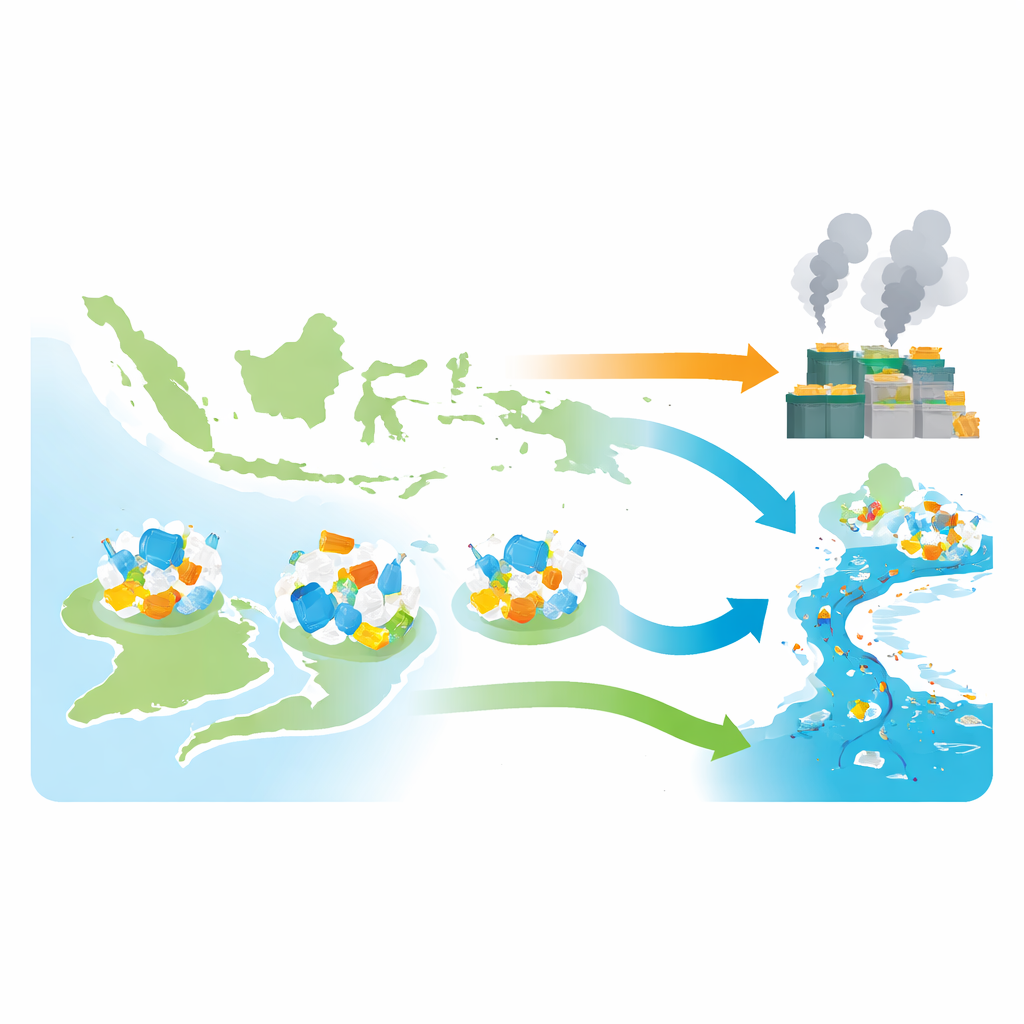
How much plastic is made, managed, and mismanaged
The study estimates that Indonesians generate about 9.21 million tonnes of plastic waste each year. Of this, only around 41 percent is properly managed through collection systems and facilities such as landfills or recovery centers. The remaining plastic is mismanaged, meaning it is burned in the open, buried without safeguards, or dumped on land and into waterways. Open burning is the single largest pathway, accounting for roughly 4.15 million tonnes per year—nearly half of all plastic waste—with most of this taking place in rural communities that lack regular collection services. In contrast, cities generate a lot of plastic but have better, though still incomplete, waste handling infrastructure.
Hotspots where plastic leaks into land and water
Not all mismanaged plastic is equally likely to reach rivers and seas. The authors distinguish between “non-leakage” forms, such as burning and simple burial, and disposal that leaves plastic directly on open land or in water. They find that about 1.16 million tonnes each year have a high chance of leaking into the wider environment: approximately 0.64 million tonnes are thrown straight into rivers, canals, or drains, while about 0.52 million tonnes are dumped on open ground. Rural subdistricts, particularly in Papua and Maluku, show the highest percentages of direct dumping to land and water, although their total waste volumes are modest compared with heavily populated Java. Still, these practices turn rivers into long-term plastic reservoirs, where trash can build up on banks and floodplains and be mobilized by heavy rains and floods. 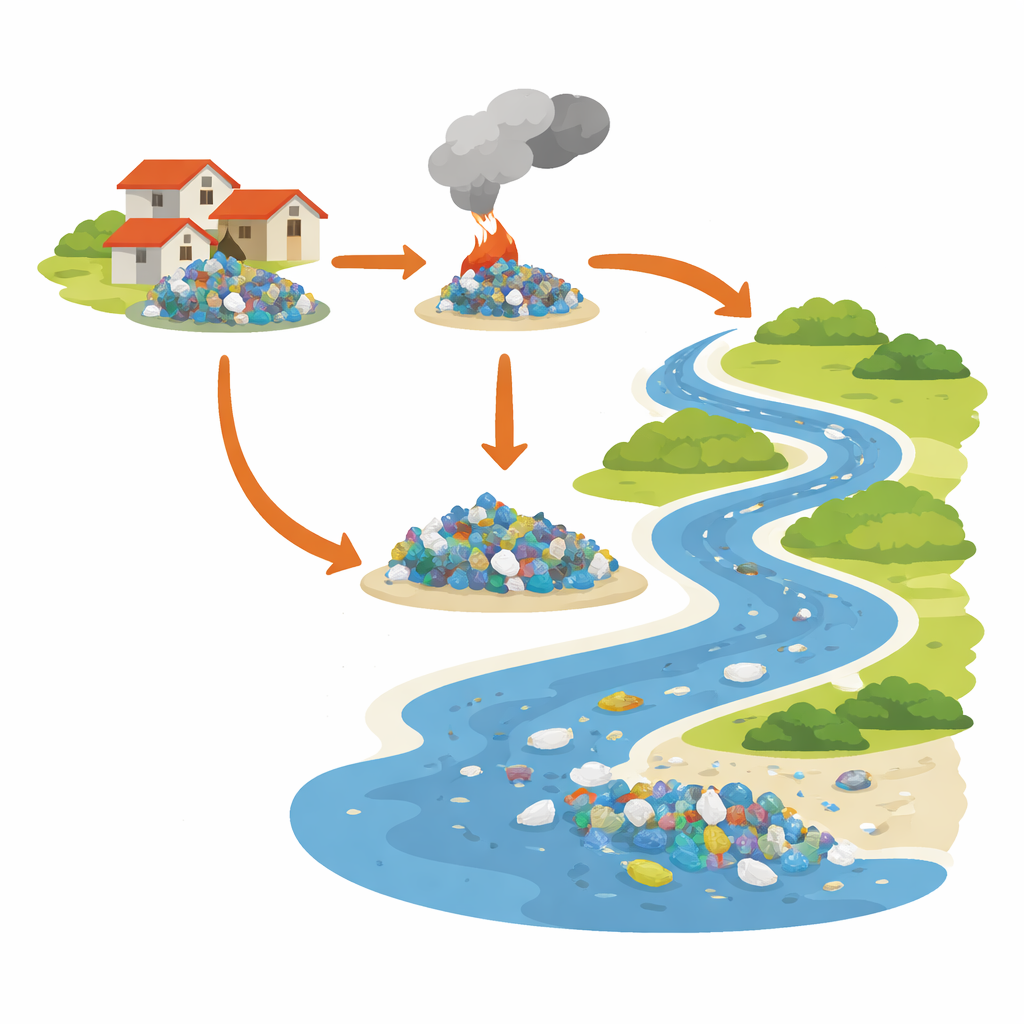
The hidden backbone of recycling and the role of uncertainty
The analysis also reveals that Indonesia’s informal waste workers—waste pickers, small aggregators, and community recycling centers—recover about four times more plastic than formal recycling systems (12 percent versus 3 percent of the total). This informal network, often operating with little official support, acts as a crucial filter that keeps large amounts of plastic from being burned or dumped. At the same time, the researchers confront substantial gaps and inconsistencies in available data, especially for rural areas. By calibrating their model separately for rural, semi-urban, and urban subdistricts and by explicitly tracking how uncertain each input is, they reduce overestimates of rural waste and narrow the range of plausible national totals. The result is a more realistic, probability-based national map of plastic leakage sources.
What this means for solving the plastic problem
For readers, the bottom line is that Indonesia’s plastic crisis is not just a single national number; it is a patchwork of local stories shaped by access to services, income, and everyday habits. The study shows that strengthening basic waste collection, especially in rural regions, curbing open burning, and supporting informal recyclers could dramatically cut the amount of plastic that reaches rivers and coasts. By pinpointing where mismanaged plastic is generated and how it moves, this work gives policymakers and communities a practical roadmap to focus resources where they will have the greatest impact—turning scattered clean-up efforts into targeted strategies that can stem the flow of plastic from land to sea.
Citation: Ramadan, A.H., Sembiring, E., Rahardyan, B. et al. Mapping mismanaged plastic waste in Indonesia: subdistrict-level analysis through material flow from sources to the environment. Sci Rep 16, 13341 (2026). https://doi.org/10.1038/s41598-026-41849-w
Keywords: plastic pollution, waste management, Indonesia, river pollution, informal recycling