Clear Sky Science · en
Global daily CO2 emissions from 1970 to 2024
Why tracking carbon day by day matters
When heat waves, cold snaps, or sudden crises like blackouts hit, our use of energy – and the carbon dioxide released from burning fossil fuels – can change in a matter of days. Yet most global carbon figures are reported only once a year, or at best once a month, hiding these rapid swings. This study pulls back the curtain by reconstructing daily fossil-fuel CO2 emissions for the world and major regions from 1970 all the way to 2024, giving scientists and policymakers a much sharper view of how human activity and weather shape the planet’s warming gases.
A long daily record of a changing world
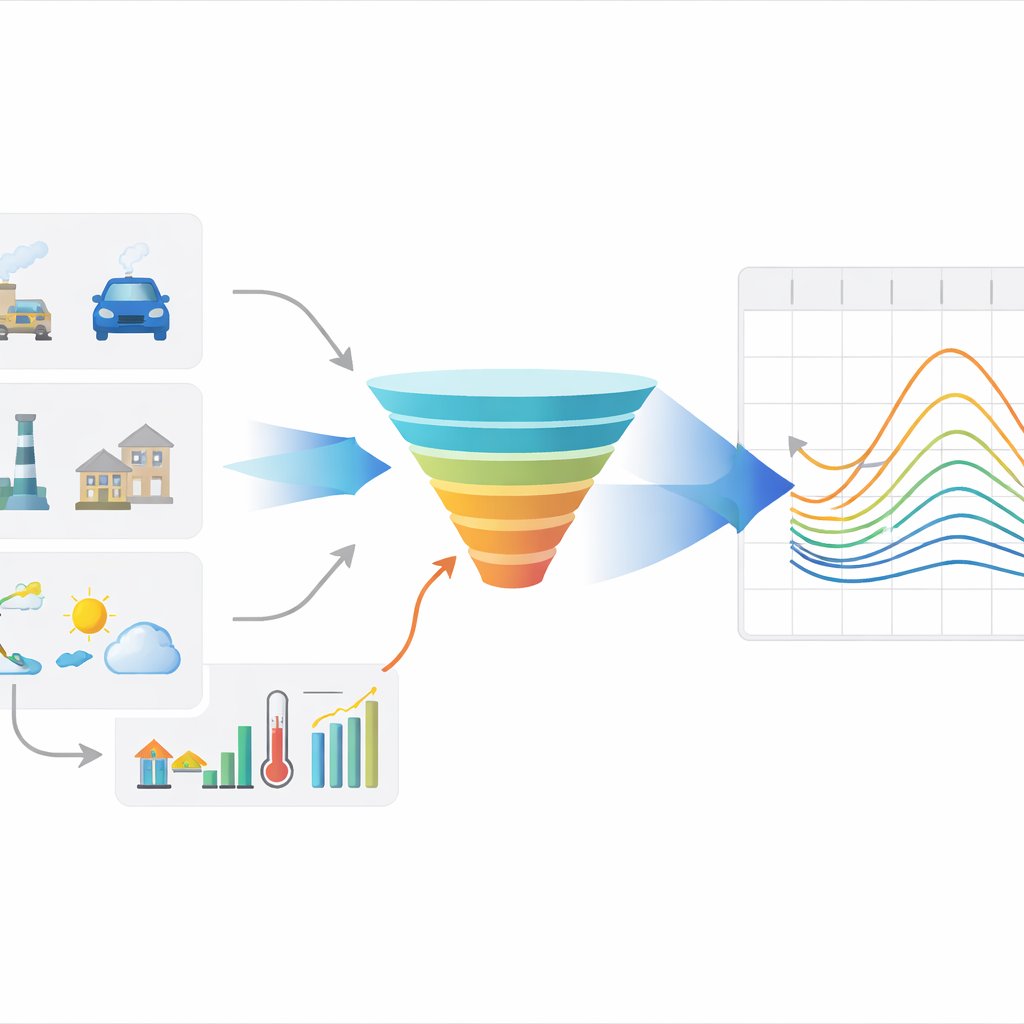
The authors set out to answer a basic but previously unresolvable question: how much CO2 does humanity emit every single day, and how has that pattern changed over more than 50 years? Existing international databases from agencies such as the International Energy Agency and EDGAR provide solid annual or monthly totals, but they are too coarse to capture short-lived events like a two-week heat wave or the sudden drop in travel during COVID-19 lockdowns. To close this gap, the team built a daily emissions record covering four main sectors – power generation, industry, residential energy use, and transportation on the ground and in the air – for 14 key countries and regions that together represent the globe’s fossil CO2 output.

Turning activity traces into daily carbon counts
For the recent period from 2019 to 2024, the researchers leaned on a vast trove of “near-real-time” activity data: electricity generation records from power system operators, traffic congestion data for hundreds of cities, industrial production indices, flight distances from aviation trackers, and gas consumption or temperature-based heating indicators. These daily or near-daily measurements act as fingerprints of how much fuel is being burned in power plants, factories, cars, and homes. Using standard emission accounting – multiplying activity by fuel-specific emission factors – they translated these fingerprints into detailed daily CO2 estimates for each country and sector.
Teaching models to replay the past
But such rich data simply do not exist back to the 1970s. To reconstruct earlier decades, the team trained machine-learning models on the recent daily record. The models learned how emissions in the power, industry, and transport sectors respond to changes in weather (temperature, sunshine, cloud cover, and wind) and to calendar patterns such as weekdays, weekends, and public holidays. Instead of predicting raw emissions, the models focused on how each day deviates from that month’s average, which helps avoid distortions from long-term shifts in energy systems. For residential emissions, which are closely tied to heating needs, the authors used a simpler approach based on “heating degree days,” a measure of how cold it feels to people, weighted by where they live.
Connecting climate, people, and daily emissions
The reconstructed daily variations were then combined with EDGAR’s monthly totals from 1970 to 2018, producing a continuous global record through 2024. The dataset resolves how emissions rise and fall not just between years, but across days and weeks, and it captures the behavior of different sectors: the steady heartbeat of power plants, the weekday rush of traffic, and the seasonal surges in heating and cooling. To check reliability, the authors compared their results against two widely used timing schemes (TIMES and EDGAR’s own daily profiles). Across countries and sectors, their daily series showed strong agreement but captured much more realistic day-to-day swings, thanks to the use of observed activity data and weather. They also quantified uncertainties, finding that daily global emissions are typically accurate within about 7% for recent years and within about one-third for the earlier period, where source data are less detailed.
A sharper tool for understanding carbon shocks
For non-specialists, the key outcome is a new “high-speed camera” on the carbon cycle. Instead of a yearly snapshot, scientists can now examine how emissions respond to specific heat waves, cold spells, holidays, lockdowns, or energy crises, and separate the human signal from natural changes in the land and oceans. This in turn can improve atmospheric models that track carbon in the air and help evaluate policies aimed at stabilizing the climate. While there are still uncertainties – especially in older data and in regions where biomass and fossil fuels mix – this long daily record marks a major step toward understanding how our energy habits and the weather interact to drive greenhouse gas emissions in real time.
Citation: Li, T., Wang, L., Qiu, Z. et al. Global daily CO2 emissions from 1970 to 2024. Sci Data 13, 605 (2026). https://doi.org/10.1038/s41597-026-06621-9
Keywords: daily CO2 emissions, climate data, energy use, extreme temperatures, carbon monitoring