Clear Sky Science · en
A Fine-Grained Lightweight Urban Signalized-Intersection Dataset of Dense Conflict Trajectories
Why busy city junctions matter
Anyone who has waited at a crowded city junction knows how chaotic it can feel, with cars, buses, bikes, and people all trying to move at once. This study asks a simple question: how can we really understand what is happening in these moments of near misses and sudden stops, so that engineers and future driverless cars can make intersections safer and smoother for everyone?
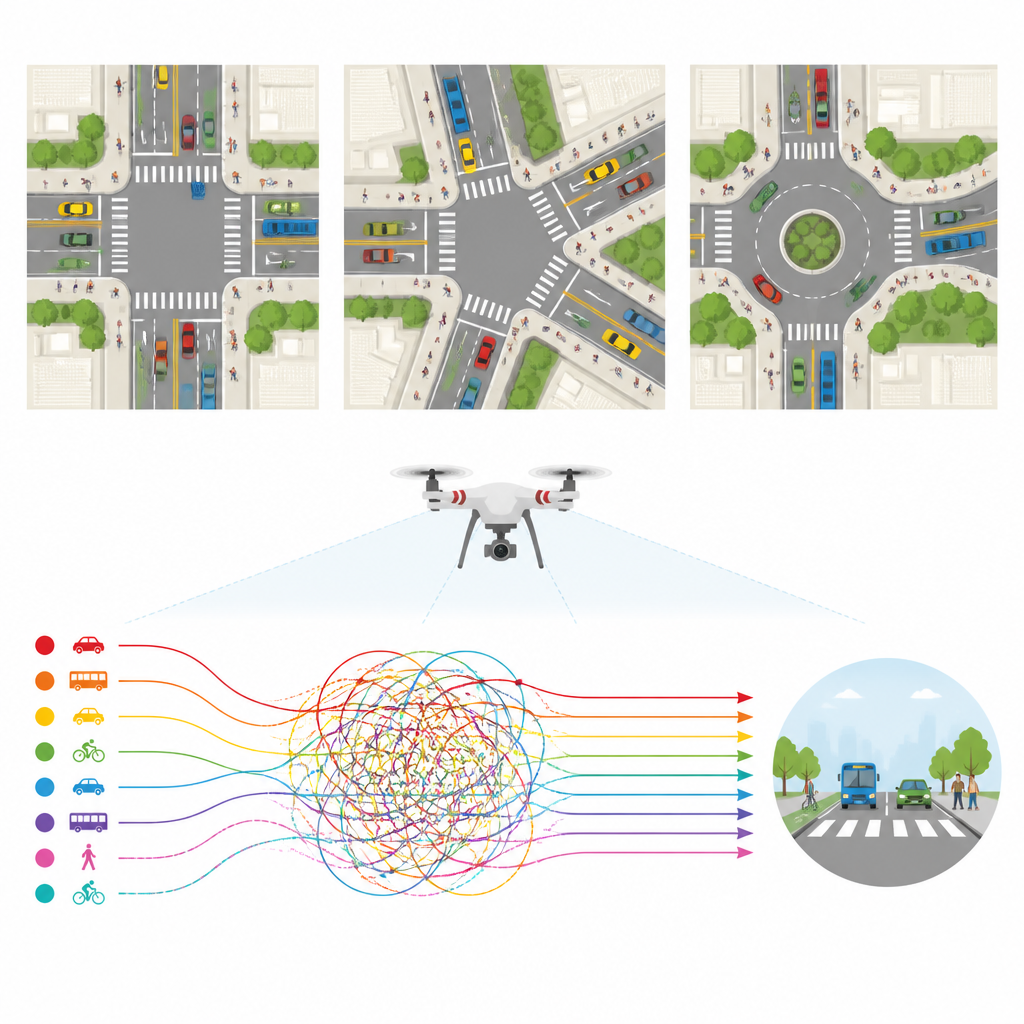
Watching traffic from the sky
To answer this, the researchers built a new dataset called FLUID by filming three busy signalized intersections in a Chinese city using a small drone. From more than five hours of video, they tracked over 20,000 road users, from cars and trucks to mopeds and pedestrians. Looking straight down from 100 to 120 meters up, the drone could see every movement across the whole junction, without distracting drivers with visible roadside cameras or test vehicles. This bird’s eye view allowed them to follow who yielded, who pushed through, and when different streams came dangerously close.
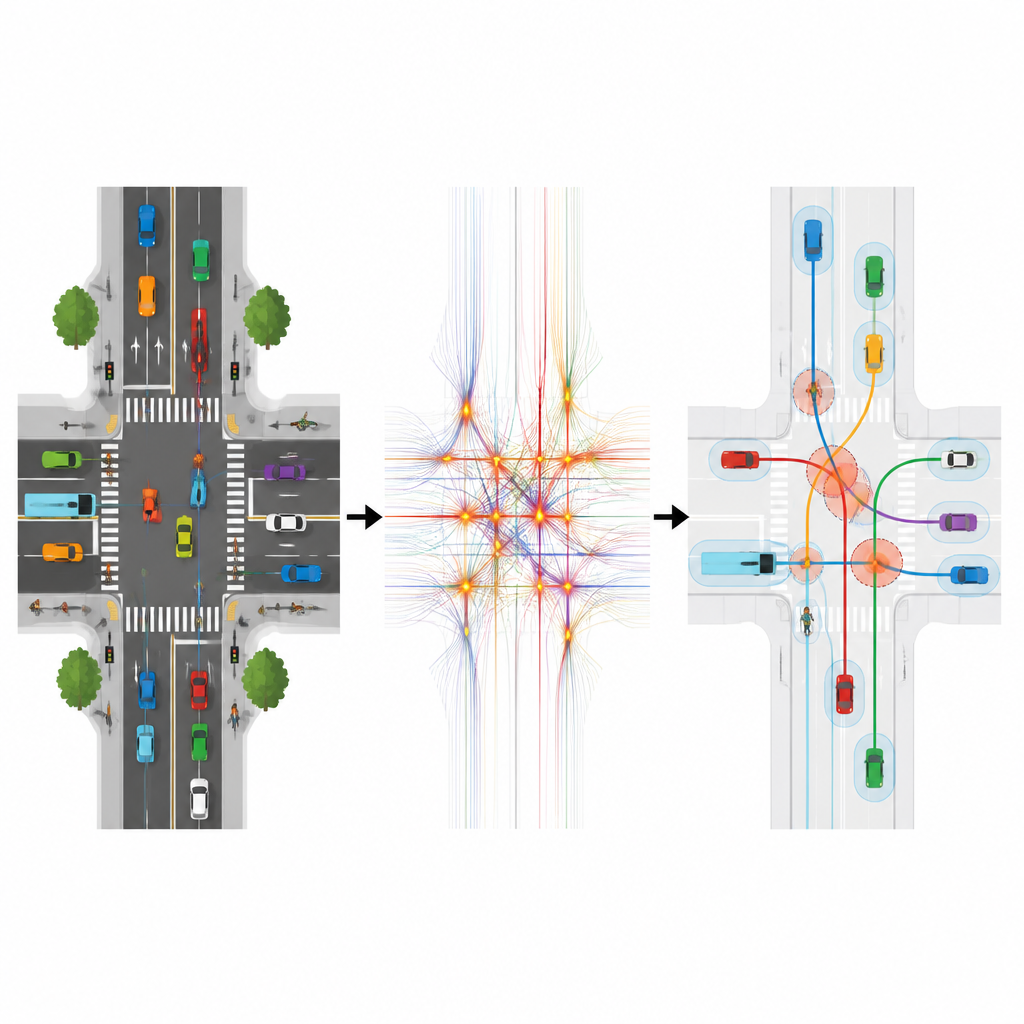
Making sense of thousands of movements
Collecting raw video is only the first step; turning it into precise paths for every road user is the real challenge. The team designed a lightweight digital pipeline that detects each person or vehicle in the frames, links those detections into continuous tracks, and then converts screen positions into real-world coordinates on a map. They combined several specialist computer vision models so that small and hard-to-spot objects such as pedestrians, mopeds, and tricycles were picked up reliably. A tracking method then stitched these detections into smooth paths, while extra processing removed camera shake, filled in short gaps, and filtered out obvious mistakes such as duplicate boxes around the same vehicle.
From paths to conflicts and risk
With clean trajectories in hand, the researchers could look for the most important events: conflicts where two vehicles or a vehicle and a vulnerable road user pass close in space and time. Using timing measures like how long remains before a likely collision if neither party changes course, they flagged thousands of such risky interactions and grouped them into rear-end, sideswipe, angle, and head-on patterns. FLUID’s intersections showed an average of 2.8 vehicle conflicts per minute, and about 15 percent of all motor vehicles were involved in at least one conflict, far higher than in many existing drone datasets. The data also contain detailed information about signal phases and turning maneuvers, making it possible to connect risky events to specific green, yellow, and red phases, and to spot red-light running and other violations.
Checking accuracy and sharing the full picture
Because safety studies rely on precise positions and speeds, the team carefully checked how accurate their data were. They compared FLUID’s results with those from a popular commercial analysis tool and with high-precision satellite-based measurements from a test car equipped with a specialist receiver. The positions of that test car in the FLUID data were within about a meter of the ground truth, and the system rarely lost or misidentified objects. Interestingly, the authors found that analyzing video at a slightly reduced frame rate helped smooth out noise in speed estimates without losing important behavior. Unlike many earlier projects, they also publish not only processed tracks but the anonymized videos, maps, signal timings, and clear documentation of every processing step.
What this means for everyday traffic
For non-experts, FLUID can be thought of as an ultra-detailed time-lapse of life at busy junctions, where every car and pedestrian path is traced and every near miss is recorded. By capturing dense, realistic conflicts and linking them to signals, turns, and violations, the dataset gives traffic engineers, city planners, and autonomous vehicle developers a powerful sandbox for testing ideas. It can support studies of who usually yields, how different signal plans affect safety, how bikes and walkers navigate risk, and how computer-driven cars should behave in mixed traffic. In short, the work delivers a clear, open, and richly annotated view of how real intersections operate, helping future systems reduce danger and delay where many crashes now begin.
Citation: Chen, Y., Wu, Z., Zheng, G. et al. A Fine-Grained Lightweight Urban Signalized-Intersection Dataset of Dense Conflict Trajectories. Sci Data 13, 766 (2026). https://doi.org/10.1038/s41597-026-07110-9
Keywords: traffic trajectories, urban intersections, drone dataset, traffic safety, autonomous driving