Clear Sky Science · en
Disaster Storylines and Knowledge Graphs from Global News with Large Language Models and Retrieval-Augmented Generation
Turning Headlines into Helpful Stories
When a flood, wildfire, or epidemic strikes, news reports pour in faster than official statistics or detailed studies. Buried in these articles are clues about what happened, who was hit hardest, and which actions helped. This paper describes a new open dataset that uses advanced AI to turn a decade of global disaster news into structured stories and maps of cause-and-effect, helping researchers, planners, and emergency services better understand how disasters unfold and how risks connect.
From Raw News to Structured Event Stories
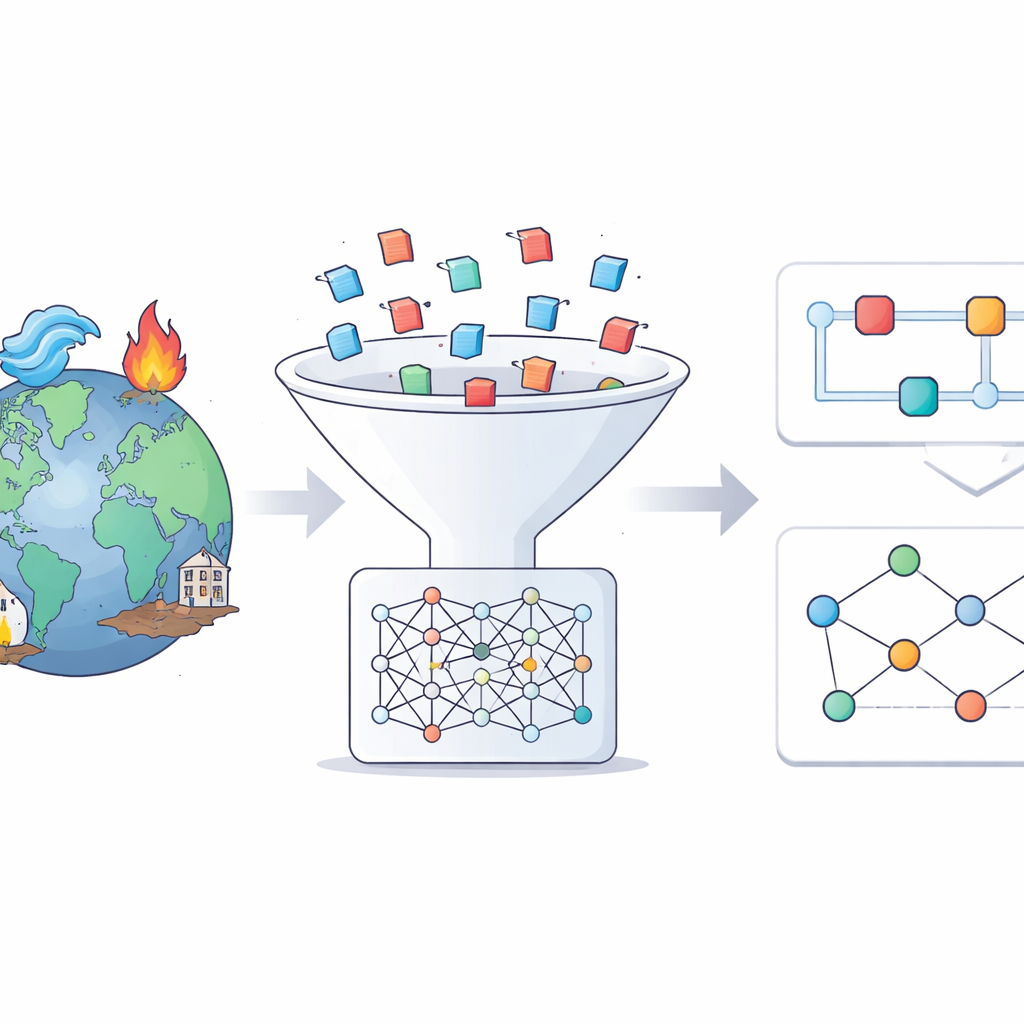
The authors start from a trusted global disaster catalog called EM-DAT, which lists thousands of major events worldwide. For each event between 2014 and 2024, they search a huge multilingual news archive, the Europe Media Monitor, focusing on English-language coverage. Using modern AI tools, they sift through millions of articles to find those that truly talk about a specific flood, earthquake, heatwave, or other hazard. Only a small fraction of retrieved articles survive this filter, but those that do provide rich, focused information about each event.
How AI Builds Narratives and Cause-and-Effect Maps
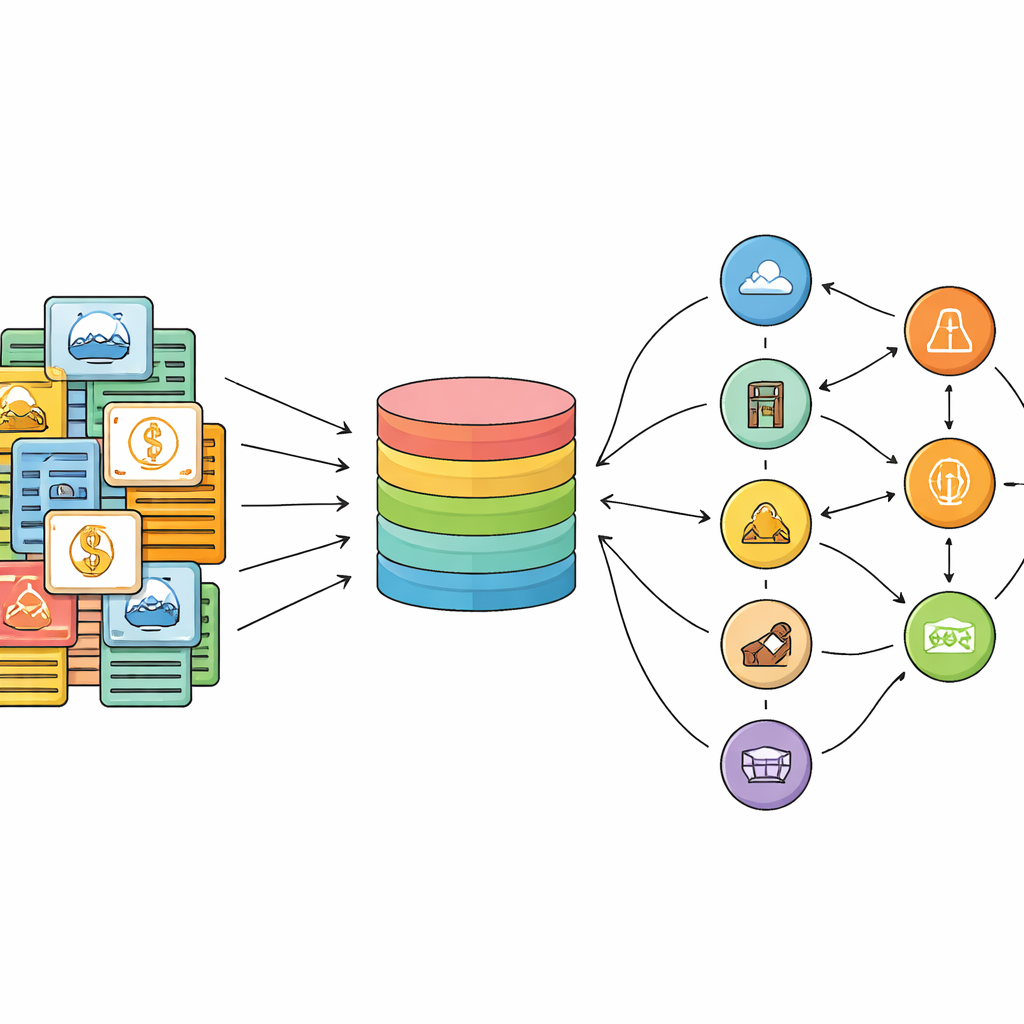
Once the relevant articles are collected, a large language model is asked to write a structured factsheet, or “storyline,” for each disaster. These narratives follow a clear template: what happened and where, how severe it was, the main drivers, who and what were exposed, the key impacts, possible knock-on risks, and the responses and recovery measures. In a second step, the same type of model reads the storyline and pulls out simple cause-and-effect statements in the form of triples such as “heavy rainfall causes flash flooding” or “early warning systems prevent casualties.” These statements are then assembled into knowledge graphs—network-like diagrams that connect hazards, drivers, impacts, and responses.
What the New Dataset Contains
The resulting dataset covers 3,158 disaster events across 175 countries and 26 types of hazards, from earthquakes and storms to droughts and epidemics. Each row in a single CSV file holds standard information from EM-DAT alongside the AI-written storyline and the extracted cause-and-effect triples. An online dashboard lets users browse events by country, type, and event code, and then inspect both the narrative and its corresponding graph. Although the system captures only about half of all EM-DAT events over the decade, it includes around 80% of reported economic losses, reflecting the intense media attention given to the most damaging disasters.
Testing Quality with Experts in the Field
Because disaster risk management is a high-stakes domain, the team carefully tested how trustworthy their AI-generated graphs are. Six experts examined 1,000 randomly sampled cause-and-effect statements and judged whether each one was supported by the source text. Overall, almost two-thirds of the statements were rated correct by a majority vote, with moderate agreement between experts. In a separate workshop, about 30 disaster professionals from European civil protection agencies reviewed 34 full graphs. Most ratings fell into “fully correct” or “mostly correct,” especially for better-documented events like floods and storms. A small online survey found that participants generally considered the narratives accurate and the graphs somewhat useful for grasping complex situations.
Why This Matters for Future Disasters
For the general public and decision makers, the key message is that this project shows how AI can help make sense of overwhelming flows of disaster news. By turning scattered reports into consistent stories and simple maps of what leads to what, the dataset supports better risk assessments, scenario planning, and early warning design. The authors stress that their graphs are not perfect or complete models of reality, and that news sources and English-language bias leave important gaps. Still, because all data, code, and prompts are openly shared, others can refine, expand, and adapt the approach. In the long run, such tools may help societies respond faster and more intelligently when the next crisis hits.
Citation: Ronco, M., Bandelli, L., Bertolini, L. et al. Disaster Storylines and Knowledge Graphs from Global News with Large Language Models and Retrieval-Augmented Generation. Sci Data 13, 689 (2026). https://doi.org/10.1038/s41597-026-07036-2
Keywords: disaster risk, knowledge graphs, news data, large language models, early warning