Clear Sky Science · en
Urban land use of national economic sectors in Guangdong-Hong Kong-Macao Greater Bay Area from 2015–2022
Why City Land Matters to Everyday Life
In the bustling cities around China’s Guangdong–Hong Kong–Macao Greater Bay Area, every factory, shop, school, and apartment block competes for limited land. As the region grows richer and more crowded, officials must decide which activities deserve precious space. This study offers a detailed new map of who uses which pieces of urban land, year by year, making it easier to balance economic growth, livable neighborhoods, and environmental protection.
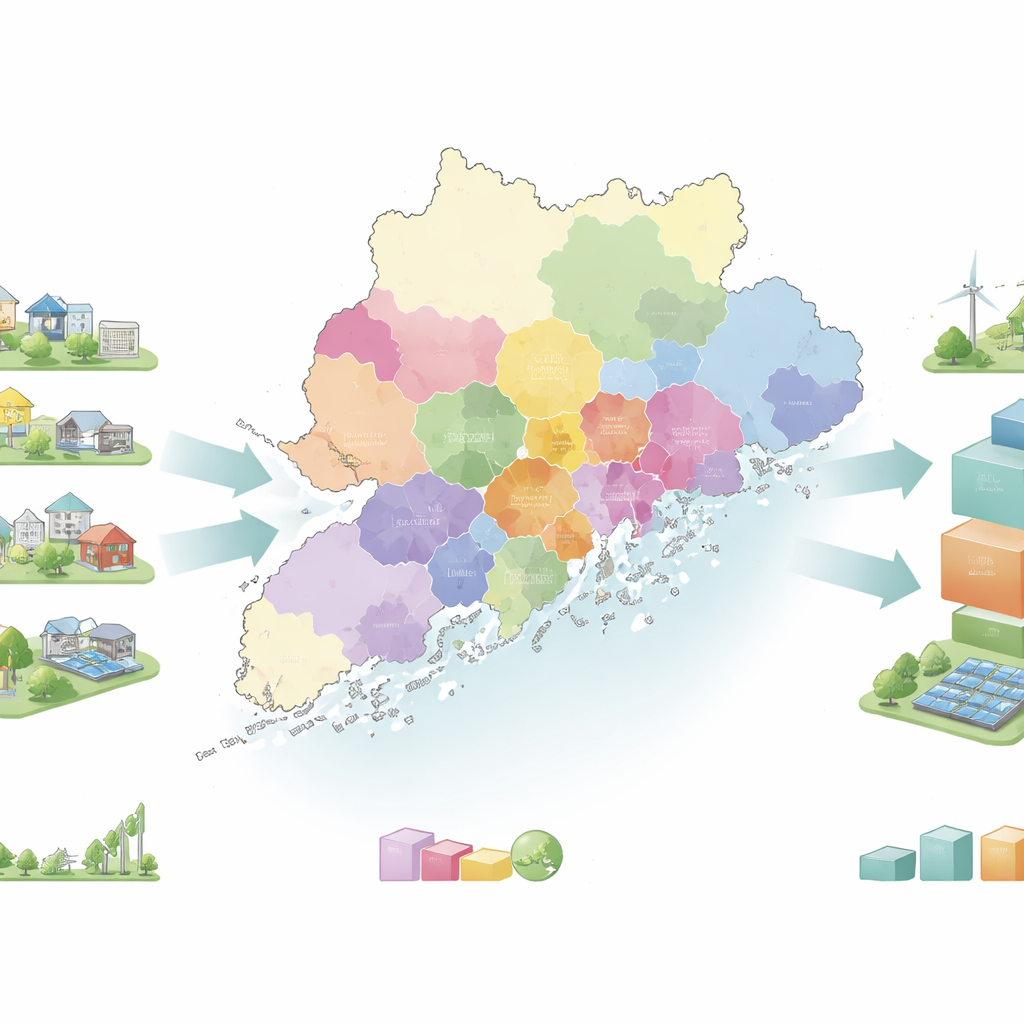
A Closer Look at a Supercharged Region
The Greater Bay Area is one of China’s economic powerhouses, linking megacities like Guangzhou, Shenzhen, and Hong Kong in a dense coastal hub. Land supply for new construction has been shrinking even as industries expand and millions of people move in. Traditional land maps show only broad categories such as “industrial,” “residential,” or “commercial,” which hides big differences between, say, a high‑tech electronics plant and a low‑value, land‑hungry furniture workshop. Without seeing these fine details, it is difficult for planners to pinpoint which sectors waste space or put the most pressure on local ecosystems.
Turning Business Footprints into a Fine Land Map
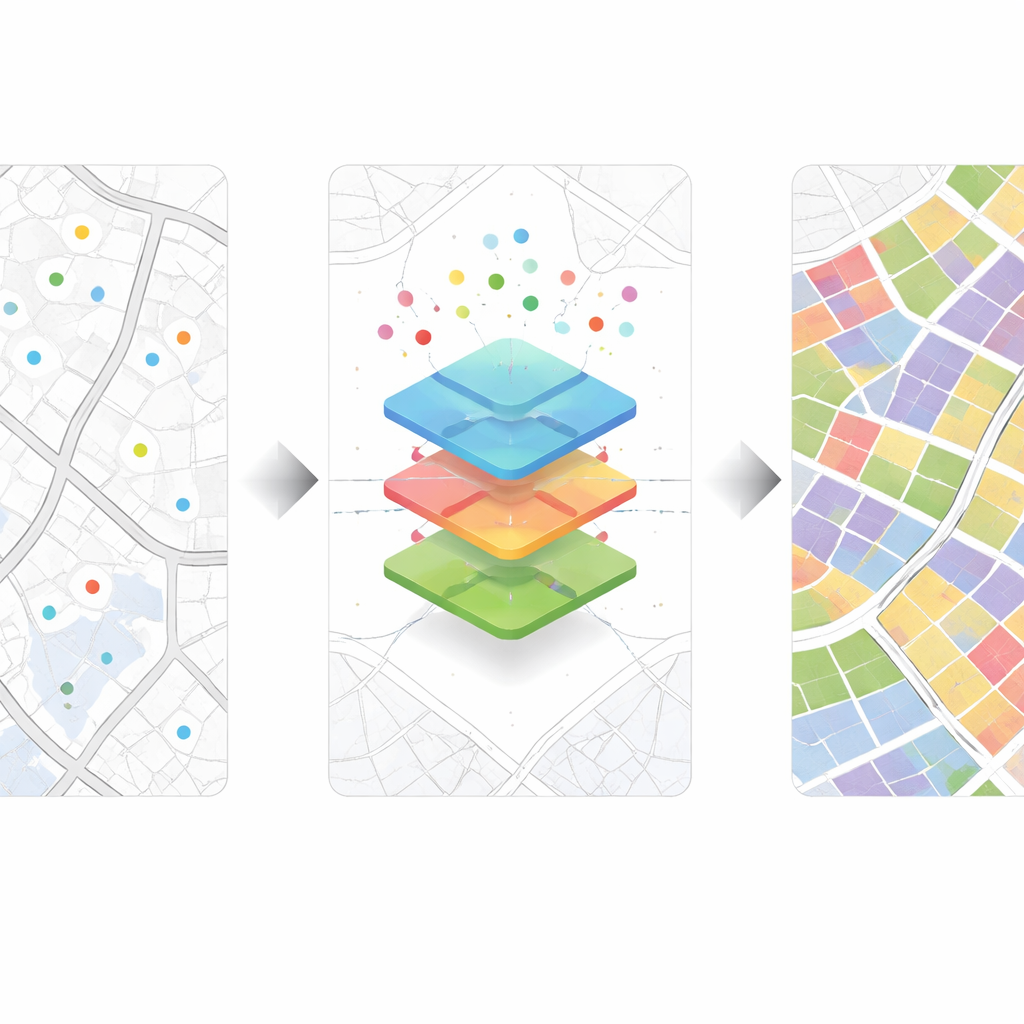
To fill this gap, the researchers built a new dataset that traces urban land use across 97 detailed economic sectors (and a more compact 42‑sector version) for all 11 Greater Bay Area cities from 2015 to 2022. They started from digital traces that many city dwellers produce without noticing: company registration records and “points of interest” from online maps that mark places like shops, factories, and services. Each record includes a business name and location. Using a modern language model known as BERT, adapted for Chinese, the team trained a classifier to read enterprise names and assign them to the correct economic sector, such as various types of manufacturing, services, or public facilities.
From Road Grids to Sector‑Colored City Blocks
Knowing where each business sits on a map is only the first step. The study then carved the cities into realistic blocks using detailed road network data and satellite‑derived “impervious surfaces” (paved and built‑up areas). Within these blocks, a geometric method called a Voronoi diagram was used to give each point of interest its own surrounding patch of territory, reflecting the area it likely influences or occupies. By clipping these patches to actual street blocks and summing them up, the researchers estimated how much built land each economic sector uses in each city and year, turning scattered locations into contiguous, sector‑colored urban parcels.
Checking the Numbers and Testing the Method
The authors carefully tested their approach. The language model correctly classified about four out of five enterprises overall, and it performed especially well for the major sectors that dominate urban economies. To verify the land allocation, the team compared their results against an independent national dataset that maps key urban land functions for China in 2018 and 2022. After aggregating their detailed sectors into broader classes like housing, offices, commerce, and industry, they found that most Greater Bay Area cities matched the reference data with an accuracy above 70 percent, and in some fast‑growing cities above 80 percent. Differences tended to occur where industrial activities are sparse or heavily mixed into other building types.
What This Means for Future Cities
For non‑specialists, the takeaway is that this work delivers a realistic, street‑level picture of how different kinds of economic activity occupy scarce urban land—and how that pattern has shifted over the last decade. Planners, economists, and environmental scientists can now link each sector’s land footprint with data on jobs, carbon emissions, or water use, helping them identify land‑hungry, low‑value activities and promote more efficient, greener development. In short, the study equips the Greater Bay Area—and potentially other megaregions—with a powerful new lens for deciding how to use every block of city space more wisely.
Citation: Li, S., Huang, Q., Su, M. et al. Urban land use of national economic sectors in Guangdong-Hong Kong-Macao Greater Bay Area from 2015–2022. Sci Data 13, 597 (2026). https://doi.org/10.1038/s41597-026-06968-z
Keywords: urban land use, Greater Bay Area, economic sectors, spatial planning, sustainable development