Clear Sky Science · en
50-Years Inland Waterway Freight Data in the Rhine-Alpine Corridor
Why rivers matter for tomorrow’s freight
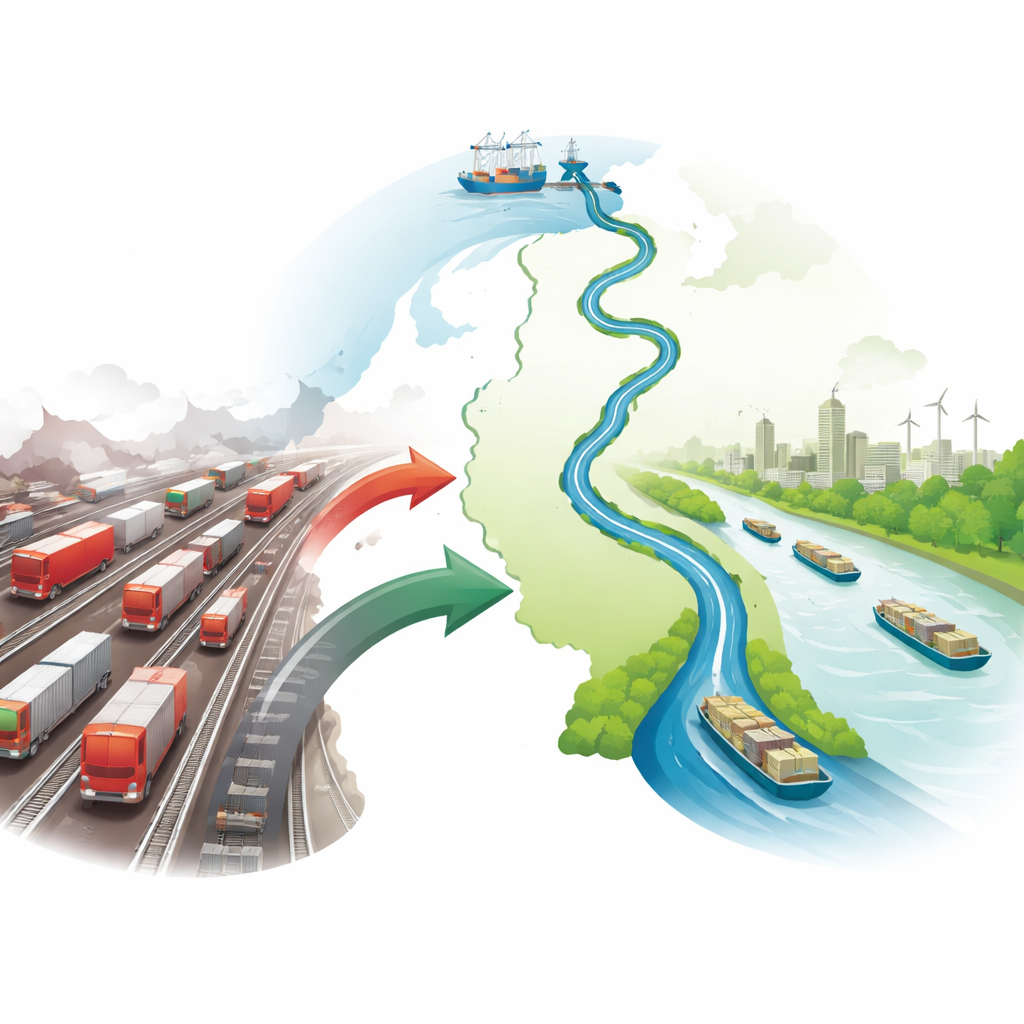
Most of the goods we rely on every day—food, fuel, building materials, and containers full of products—must move across long distances. In Europe, trucks have carried most of this load, bringing congestion, air pollution, and rising climate impacts. This article describes a new public dataset that tracks how freight has moved by inland ships along Europe’s busiest river corridor—the Rhine–Alpine route—over the last 50 years. By opening up this long, detailed record, the authors give planners, researchers, and citizens a way to better understand how river transport has changed and how it could help build a cleaner freight system.
Half a century of goods on the water
The study focuses on inland waterway transport, which uses barges and other vessels on rivers and canals to move goods between seaports and inland regions. This mode of transport emits far less carbon dioxide per ton of cargo than road traffic and is far from using its full capacity. Yet, until now, anyone who wanted to see long-term trends in river freight faced a patchwork of partial statistics. The authors have assembled and harmonized data covering 50 years, from 1970 to 2023, with special attention to the Rhine–Alpine Corridor that links major ports like Rotterdam and Antwerp with industrial regions in Germany, Switzerland, and beyond. This corridor handles about 70% of all inland waterway freight in Europe, making it a key testbed for greener transport policies.
Turning scattered records into one clear picture
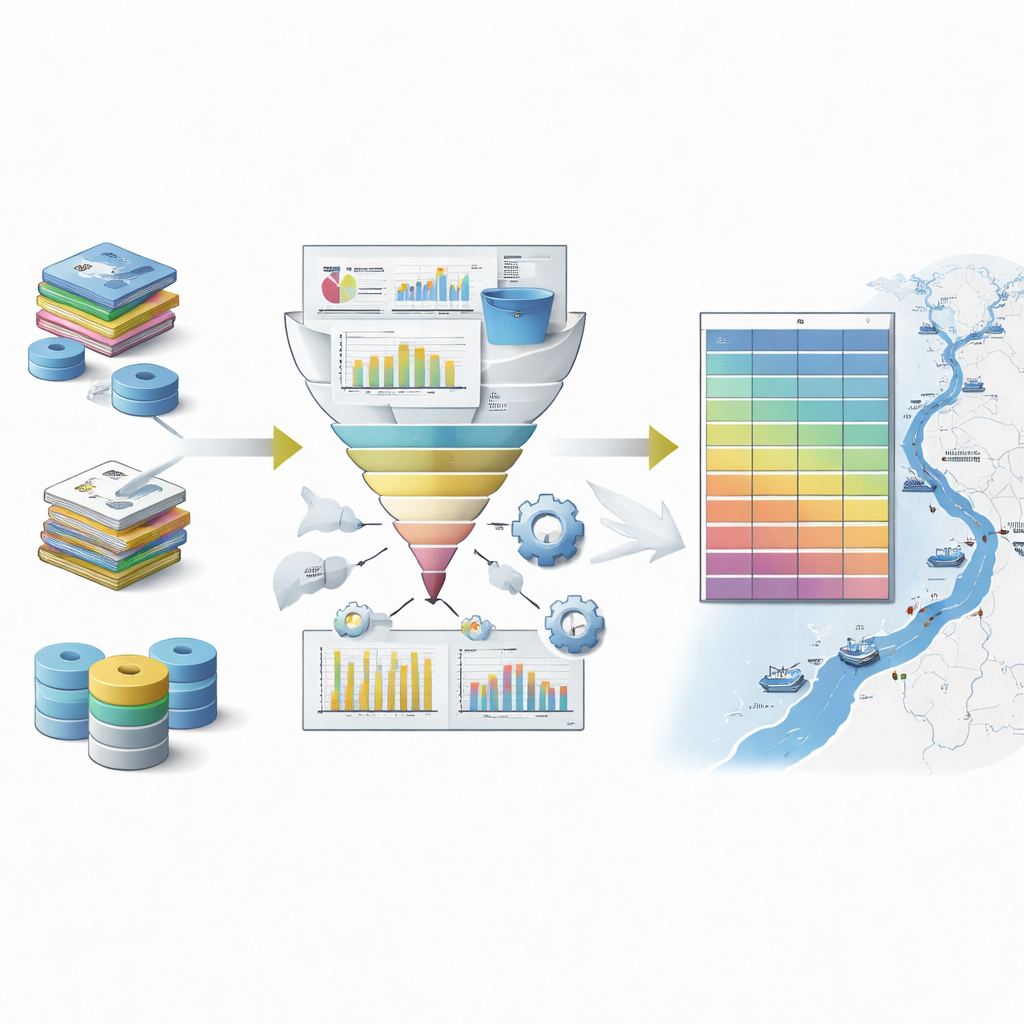
Creating this dataset required much more than simply collecting files. Different countries store freight data in different formats, count different types of goods, and change their classification systems over time. For example, European statistics shifted from one goods coding scheme to another in 2007, and some countries provide only broad categories while others offer very fine detail. The team combined official sources from European and national offices, historical archives, and modern digital tables. They then built correspondence tables that translate between old and new goods classifications and between regional coding systems, so that information from the 1970s can be meaningfully compared with today’s figures.
Filling gaps and rescuing old records
Many years and countries had missing or incomplete values, especially at the detailed level of specific freight categories. To repair these gaps, the authors used statistical techniques that look at patterns over time to estimate likely values, while forcing the totals to match known aggregates so that overall numbers remain trustworthy. For the Netherlands, the early records existed only as scanned pages; the team used optical character recognition software, followed by manual checks, to turn these images into usable digital tables. They also mapped older Dutch traffic zones onto today’s European regional grid so that origin–destination patterns over the decades could be studied in a consistent way.
What the long view reveals about river freight
With the data cleaned and aligned, the authors could sketch how inland shipping has evolved. Overall, freight on the Rhine–Alpine Corridor grew modestly over 50 years, but with strong differences between goods. Volumes of mineral oil and chemical products more than doubled or tripled, and container transport grew from almost nothing into a major segment. Coal transport rose for decades before dropping sharply in recent years as German mines closed and energy systems shifted. Construction materials declined but still dominate by weight. By tracing where goods are loaded and unloaded, the dataset also shows how flows cluster around hubs such as Rotterdam, Antwerp, and Duisburg, and how they spread upstream into industrial and chemical regions.
How this new resource can be used
To check reliability, the team compared independent sources—for example, Dutch and German counts of shipments crossing their shared border—and used ship-position data to spot under-reporting. While some differences remain, the patterns over time are consistent enough for robust trend and network analysis. The final product consists of two open files: one describing total yearly performance by country, and another detailing yearly volumes by country, goods type, and, for the Netherlands, loading and unloading regions. Together with accompanying mapping tables and code, this resource allows others to reproduce the work, test new ways of estimating missing values, and link river freight to climate, economic, or infrastructure studies.
What this means for people and policy
For non-specialists, the key message is that Europe now has a transparent, long-term record of how much cargo has moved on its inland waterways, what kinds of goods were carried, and where they went. This makes it far easier to explore questions such as how river shipping responds to droughts and floods, how crises like the COVID-19 pandemic affect freight choices, and how much traffic might shift from road to water if policy incentives change. By investing in careful data rescue and harmonization, the authors have built a foundation that anyone—from city planners to environmental advocates—can use to design, test, and debate more sustainable freight futures.
Citation: Turpijn, B., Baart, F., Tavasszy, L. et al. 50-Years Inland Waterway Freight Data in the Rhine-Alpine Corridor. Sci Data 13, 472 (2026). https://doi.org/10.1038/s41597-026-06875-3
Keywords: inland waterway transport, freight data, Rhine-Alpine corridor, sustainable logistics, European transport statistics