Clear Sky Science · en
A dataset of harmonized global air quality monitoring metadata
Why cleaner air data matters to everyday life
Air pollution from tiny particles in the air is one of the world’s leading environmental health risks, contributing to millions of premature deaths each year. Governments rely on thousands of ground monitoring stations to know when and where air is unsafe to breathe. Yet these stations are described in very different ways from country to country, making it surprisingly hard to compare air quality across regions or to judge how well policies are working. This study presents a new global dataset and method that bring order to this patchwork, helping scientists and policymakers see the big picture of air pollution exposure more clearly.
Seeing the global patchwork of air monitors
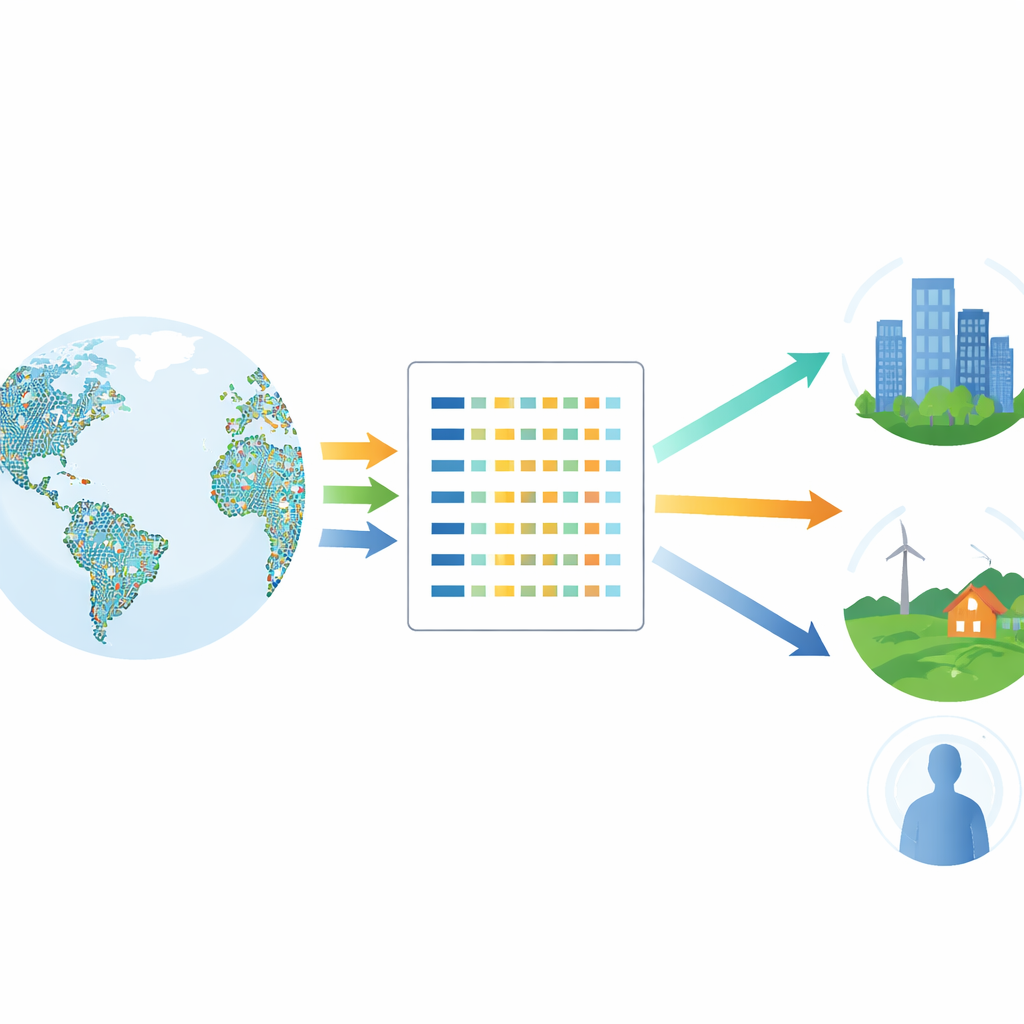
The authors start from a simple but powerful idea: the value of air quality measurements depends not only on what is measured, but also on where and why. A station next to a busy highway tells a different story than one in the countryside far from major sources. Agencies usually label stations along two dimensions: whether they are in an urban or rural area, and whether they capture background conditions or are strongly influenced by local sources such as traffic or industry. However, there is no consistent worldwide system for assigning these labels. By gathering information from official networks in places like Europe, the United States, Canada, Japan, South Africa, and others, and combining it with locations from an open global platform, the team assembled metadata for about 15,000 particulate matter monitoring sites in 106 countries.
Using images and numbers to understand each site
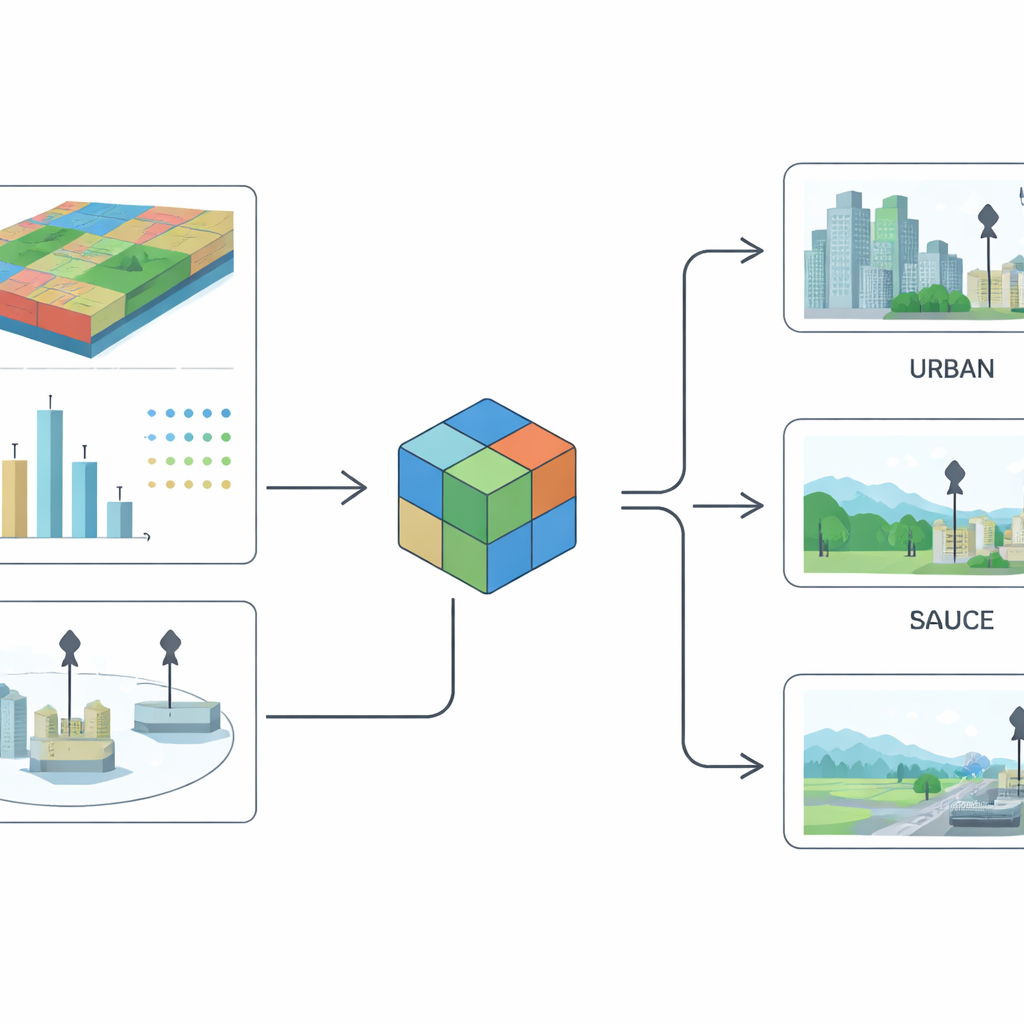
To harmonize station labels across very different national systems, the researchers turned to detailed information about the surroundings of each monitor. They used ultra-fine land-cover maps from European Space Agency satellite products, which describe whether an area is built-up, covered by trees, cropland, water, or other surfaces at a resolution of about 10 meters. Around every station, they cut out a small square image roughly two kilometers on a side, capturing nearby roads, neighborhoods, fields, and industrial areas. They then added several layers of supporting data: estimates of fine-particle and carbon monoxide concentrations, population density, emissions of key pollutants from different sectors, and locations and types of large industrial plants such as coal power stations, steel mills, and cement factories.
How the classification tool works under the hood
With these inputs, the team trained advanced image-recognition models to infer how each station should be labeled. Their approach works in two stages. First, the model learns to distinguish urban from rural sites using labeled examples and satellite tiles. Second, it uses that knowledge together with all other data to decide whether a station measures general background air or is dominated by nearby sources. To make the most of both pictures and numbers, they designed a fusion architecture that lets an attention mechanism weigh, for each station, how much to trust visual cues versus numeric indicators like emissions or population. This method is built on modern neural network designs originally developed for large image datasets and adapted to the specific needs of air quality monitoring.
What the new global dataset provides
The outcome is Metair, a harmonized global catalogue of particulate matter monitoring stations. For each site, the dataset lists an identifier, country, location, elevation, the pollutant measured, whether the site is urban or rural, and whether it is classified as background or non-background. It also records whether those labels came directly from an official source or were estimated by the model, along with summary measures of the model’s confidence and performance. Overall, the model performs very well for the simpler urban–rural split and reasonably for the more complex background versus source-affected distinction, reflecting how visually and statistically subtle that second divide can be in real cities. The authors provide not only the dataset, but also the input imagery and code so others can reproduce or extend their work.
How this helps protect public health
For non-specialists, the key payoff is that this work makes it much easier to ask and answer consistent questions about air pollution around the world. With a common framework for station types, researchers can better compare how much different sectors contribute to exposure in different regions, or how changes in policy shift pollution at true background locations versus traffic hot spots. Health studies can more reliably link monitoring data to disease outcomes, knowing what kind of environment each station represents. Environmental agencies can also use the model as a planning aid, checking whether proposed new monitors are likely to sample the conditions they care about. In short, by tidying up the "metadata" that describe where and what stations are measuring, this study lays a stronger foundation for global air quality analysis and for efforts to reduce the health burden from dirty air.
Citation: Renna, S., Rodriguez-Pardo, C. & Aleluia Reis, L. A dataset of harmonized global air quality monitoring metadata. Sci Data 13, 466 (2026). https://doi.org/10.1038/s41597-026-06797-0
Keywords: air quality monitoring, particulate matter, satellite data, machine learning, environmental health