Clear Sky Science · en
Numerical and experimental analysis of flow distortion induced by ultrasonic transducers in gas flowmeters
Why tiny flow twists matter for big gas bills
Natural gas is often priced by how much volume passes through a pipeline, and ultrasonic flowmeters are a popular way to keep track. These devices listen to sound pulses racing through the gas, then convert travel times into a flow reading. But the sensors that send and receive the sound slightly disturb the stream they are trying to measure. This study asks a practical question with financial consequences: how much do those small disturbances skew the reading, and can we correct for them reliably?
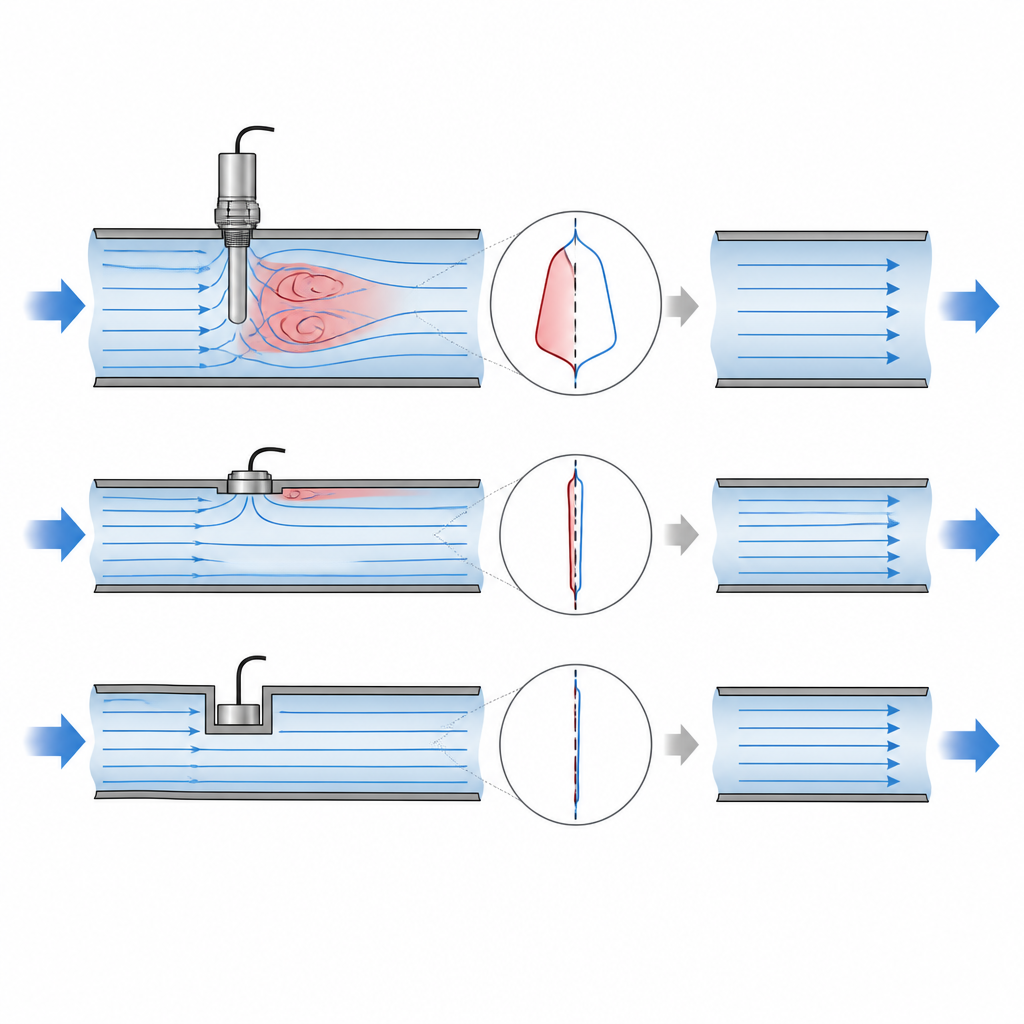
Three ways to place the sensors
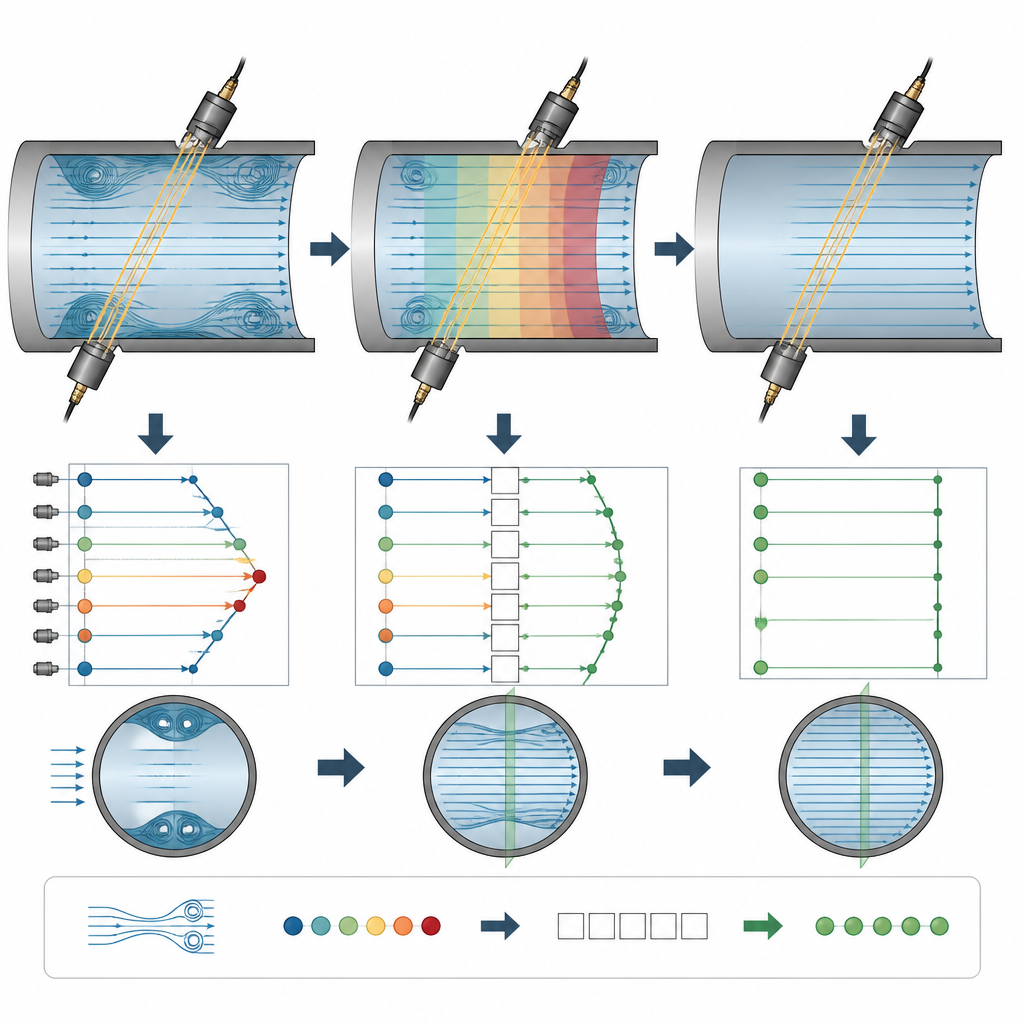
The researchers focused on three common ways to mount ultrasonic transducers inside a pipe: sticking them entirely into the gas stream, tucking them fully into recesses in the wall, or placing them so they just touch the inner surface along a tangent. Using a simplified model of a gas meter with a 10 centimeter wide pipe, they tracked how gas flow develops before and after the sensors. The sound paths cross the pipe at a standard 60 degree angle, a compromise widely used in industry that balances signal strength and sensitivity to the main flow direction. In all cases, the basic measurement principle is the same: several sound paths sample the flow, and a mathematical recipe combines those samples into a single flow rate.
How flow separates and bends around obstacles
Computer simulations revealed that flow near the transducers is far from uniform. When a sensor protrudes into the stream, the gas climbs over its wedge-like face, speeds up, then encounters an adverse pressure region that peels the boundary layer away and creates swirling pockets of backflow behind the sensor. Recessed sensors carve out small cavities where gas can recirculate, forming low pressure zones and vortices inside the grooves. Even the tangent arrangement, which does not change the sound path length, produces smaller but still noticeable eddies and sideways motion. Across all three setups the same pattern emerges: backflow and sideways currents near the transducers make the average speed seen by the sound slower than the true bulk flow.
Measuring and fixing the hidden bias
To turn these flow pictures into numbers, the team calculated the average speed along each sound path and compared it with an undisturbed reference section upstream. They split each path into three regions: an upstream recirculation zone, a central core where the flow may be throttled or expanded, and a downstream region where asymmetries remain. By adding the gains and losses from each region, they could explain why the total error was always negative. For projecting sensors, typical errors ranged from about one to two percent below the true value; tangent sensors showed roughly two to four percent low; fully recessed sensors were off by nearly ten percent. The authors then built simple correction formulas that relate the measured speed along a given path to its effective length and open flow width, which together describe how much of the path lies in distorted regions.
Putting the corrections to the test
Numerical results alone are not enough for a device that bills gas deliveries, so the team validated their models in a high pressure test loop using air. They tested real ultrasonic meters of two pipe sizes under various pressures and flow rates, focusing on the tangent sensor layout used in many compact meters. Before correction, errors caused by local turbulence were consistently negative and fell between about one and four percent, matching the simulations. Applying the path-based correction formula brought the error in a 10 centimeter meter down to roughly minus one and a half to zero percent, while a 20 centimeter meter already met typical accuracy limits after this first step. To improve the smaller meter further, the authors introduced a second correction based on Reynolds number, a standard indicator of flow regime, fitted from experimental data; this reduced errors to within about half a percent.
What this means for real-world metering
For gas companies and meter designers, the study delivers both a warning and a tool. The warning is that small sensor details and mounting choices can systematically make meters read low, especially in smaller pipes where the disturbances take up a larger share of the cross section. The tool is a set of easy-to-apply correction formulas, supported by both simulations and experiments, that can shrink these installation effects to within one percent or better. While the exact coefficients depend on the specific meter design and still require calibration, the work clarifies the main physical culprits and shows how to tame them, helping future ultrasonic meters deliver fairer and more reliable gas measurements.
Citation: Chen, W., Yao, C., Wang, D. et al. Numerical and experimental analysis of flow distortion induced by ultrasonic transducers in gas flowmeters. Sci Rep 16, 15974 (2026). https://doi.org/10.1038/s41598-026-46908-w
Keywords: ultrasonic flowmeter, gas metering, flow distortion, transducer installation, Reynolds number correction