Clear Sky Science · en
Saddlepoint inference for rank-based k-sample tests in clustered survival trials
Why this matters for real-world trials
Many modern clinical trials no longer track just a single, simple outcome like blood pressure at one visit. Instead, they follow patients over time, combine multiple measurements, and often compare several treatments at once. When patients are treated in groups, such as in hospitals or clinics, and the outcomes are complex ratios or products observed over time, standard statistical tools can give answers that are too confident and sometimes simply wrong. This paper introduces a more accurate way to analyze such trials so that claims about treatment benefits or harms are less likely to be misleading.
Trials run by groups, not by people
In public health and medicine, researchers often randomize treatments by cluster: whole clinics, schools, or communities are assigned to different study arms, and everyone inside a cluster receives the same regimen. This design is logistically attractive and helps prevent “contamination” between treatments, but it creates a strong family resemblance among people in the same cluster—their outcomes tend to move together. At the same time, trials increasingly summarize health changes using derived measures, such as the ratio of two lab values or the cumulative product of repeated readings over time. When researchers try to compare several treatment groups using these complex, group-based outcomes, the usual rank-based tests that work well for large, independent samples can break down. In small or moderately sized cluster trials, the common shortcut that approximates the test statistic with a chi-squared curve often inflates false alarms and produces confidence intervals that are too narrow.

Turning messy measures into comparable "times"
The author’s first step is to re-express complicated outcomes in a common language: time-to-event data. Ratios, such as one blood marker divided by another, are treated as the “time” it takes to reach a critical ratio; products of several measurements are turned into a single combined value, often after a logarithmic transformation to stabilize variation. Each patient is then summarized by when their derived value crosses a threshold or by how long they are followed without crossing it, mirroring ordinary survival analysis. Because patients live inside clusters, the method assigns each individual a weighted rank-based score that accounts for censoring—when follow-up ends before the event occurs—and then sums these scores within each cluster. The result is one summary number per cluster, capturing both the timing of events and the correlation among people in the same group. A global quadratic statistic is then built from these cluster scores to compare all treatment arms at once.
A sharper lens on chance variation
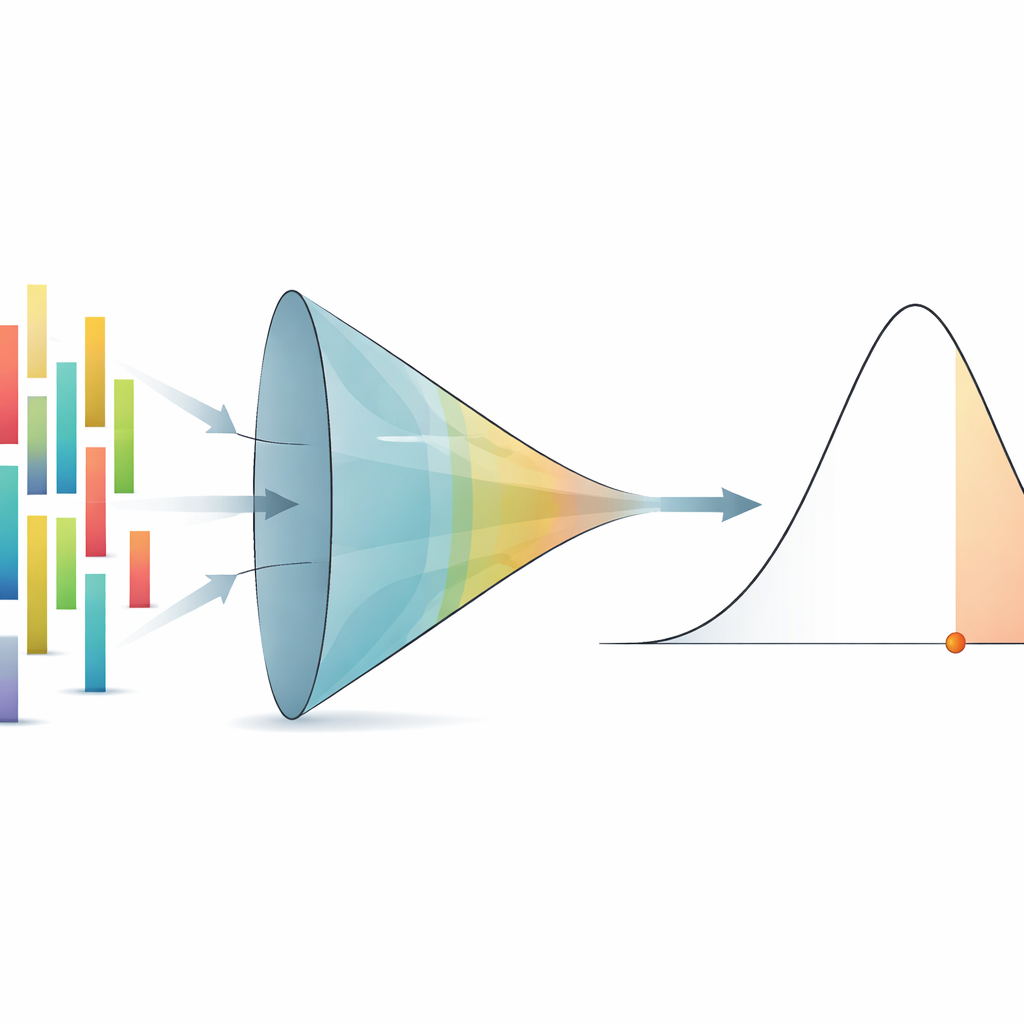
In principle, the fairest way to judge whether an observed difference between treatment groups is surprising is to look at all possible ways the clusters could have been assigned to treatments under the actual randomization scheme and see how extreme the test statistic would be across that entire set. For cluster trials using an urn-like allocation—drawing treatment labels from a conceptual pot without replacement—this means exploring a huge number of permutations. Exhaustively listing them is impossible for realistic studies, and simulating them by computer thousands of times is expensive if repeated for many tests or for the construction of confidence intervals. The paper introduces a multivariate saddlepoint approximation, a mathematical shortcut that uses the full behavior of the test statistic’s generating function, rather than just its average and spread, to mimic this permutation distribution with striking accuracy, even in the far tails where p-values live.
Putting the method to the test
The new framework is stress-tested through extensive simulations that mimic real-world multi-arm cluster trials with varying numbers of treatment groups, different cluster sizes, several levels of within-cluster correlation, and both moderate and heavy censoring. Across 20 challenging scenarios and two families of derived endpoints—ratios and products—the saddlepoint-based p-values closely match near-exact “gold standard” values obtained from large numbers of random permutations. By contrast, the familiar chi-squared approximation often rejects the null hypothesis too often in small or highly correlated settings, especially when many treatment groups are compared. The same pattern appears for confidence intervals: when built by inverting the saddlepoint test, intervals for treatment effects cover the true value at the advertised 95% rate, whereas chi-squared-based intervals can miss it far too frequently, particularly in borderline designs where decisions are most sensitive.
Lessons from real clinical studies
To show the stakes in practice, the author applies the method to three multi-center clinical trials: a leukemia study measuring how quickly blood counts recover, an age-related eye disease study tracking combined vision loss in both eyes, and a periodontitis trial assessing gum disease progression within mouths. In two of these cases, the standard analysis using chi-squared approximations declares a treatment effect “statistically significant” at the conventional 5% level, potentially prompting strong clinical conclusions. The saddlepoint method, along with near-exact permutation benchmarks, instead yields slightly larger p-values and wider intervals that include “no effect,” signaling that the evidence is suggestive but not decisive. In a large, high-power vision study, all methods agree that treatment is beneficial, but the saddlepoint intervals again avoid over-claiming precision, offering a more honest picture of uncertainty.
Clearer answers from complex data
For lay readers, the key message is that not all statistical tools are equally trustworthy when trials get complicated and sample sizes are limited. This work provides a principled, computationally efficient way to honor the actual randomization scheme of cluster trials and the intricacies of modern endpoints without resorting to heavy simulation or fragile large-sample shortcuts. By reliably controlling false positives and delivering confidence intervals that keep their promises, the saddlepoint framework helps ensure that conclusions about new therapies—especially in finely balanced or smaller multi-center studies—are based on evidence that is as solid as the data allow, no more and no less.
Citation: Newer, H.A. Saddlepoint inference for rank-based k-sample tests in clustered survival trials. Sci Rep 16, 11372 (2026). https://doi.org/10.1038/s41598-026-44064-9
Keywords: cluster randomized trials, survival analysis, saddlepoint approximation, permutation tests, small-sample inference