Clear Sky Science · en
Mamba ECIS for power marketing customer behavior forecasting using multimodal deep learning
Why smarter power predictions matter
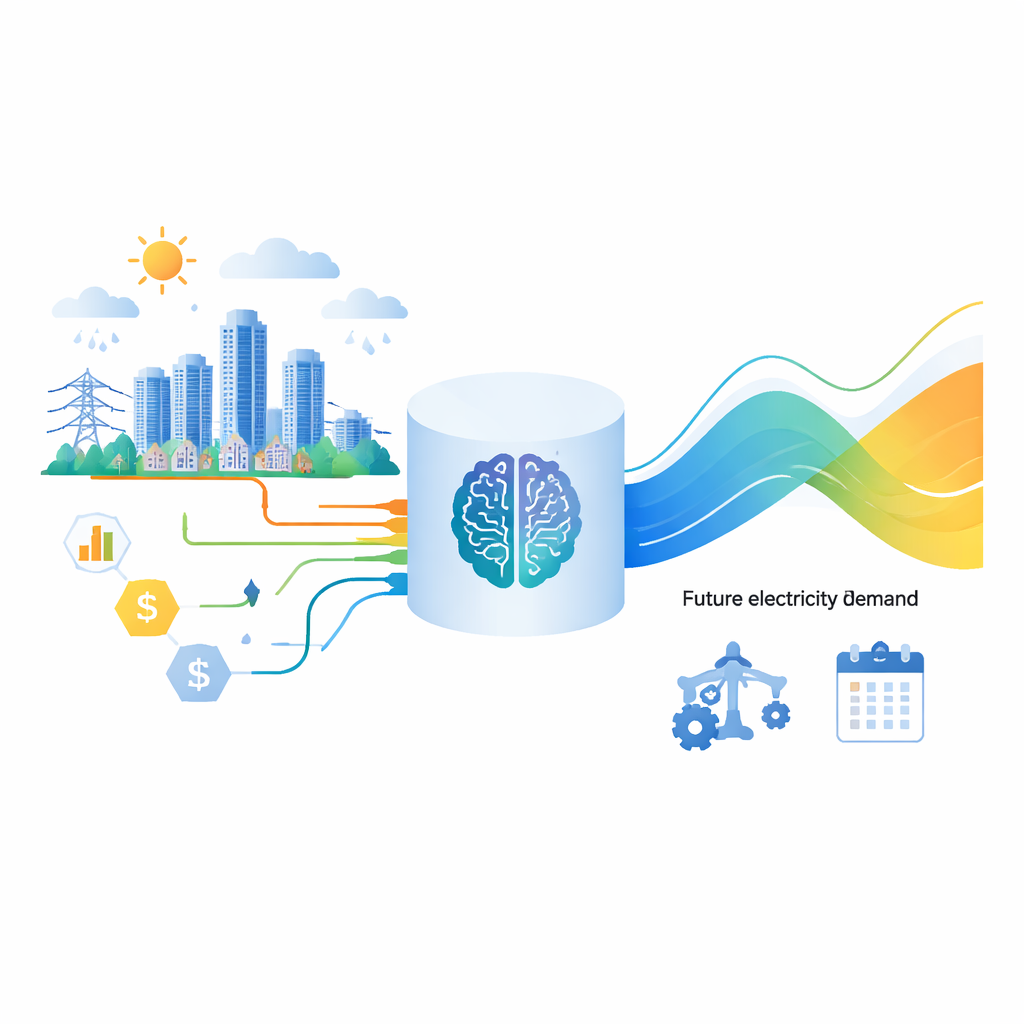
Keeping the lights on at the right price means power companies must constantly guess how much electricity people will use in the next hour, day, or week. Those guesses are getting harder as weather grows more extreme, prices fluctuate, and homes bristle with smart meters and connected devices. This paper introduces a new forecasting system called Mamba‑ECIS that uses advanced artificial intelligence to read many kinds of data at once, separate short‑term jitters from long‑term habits, and explain which outside factors truly drive customers’ electricity use.
From simple guesses to rich digital portraits
Traditional forecasting tools were built for a simpler world. They usually relied on a single type of information, such as past electricity use, and assumed that patterns would stay fairly steady over time. As data volumes exploded and customer behavior became more complex, these methods began to fall short. Even modern deep‑learning approaches, while powerful, often work as opaque “black boxes” and struggle to cleanly combine weather, prices, calendar effects, and other signals. The authors argue that tomorrow’s power system needs models that can absorb many data sources, track both rapid swings and slow drifts in demand, and still offer human‑readable insight.
Blending many signals into one story
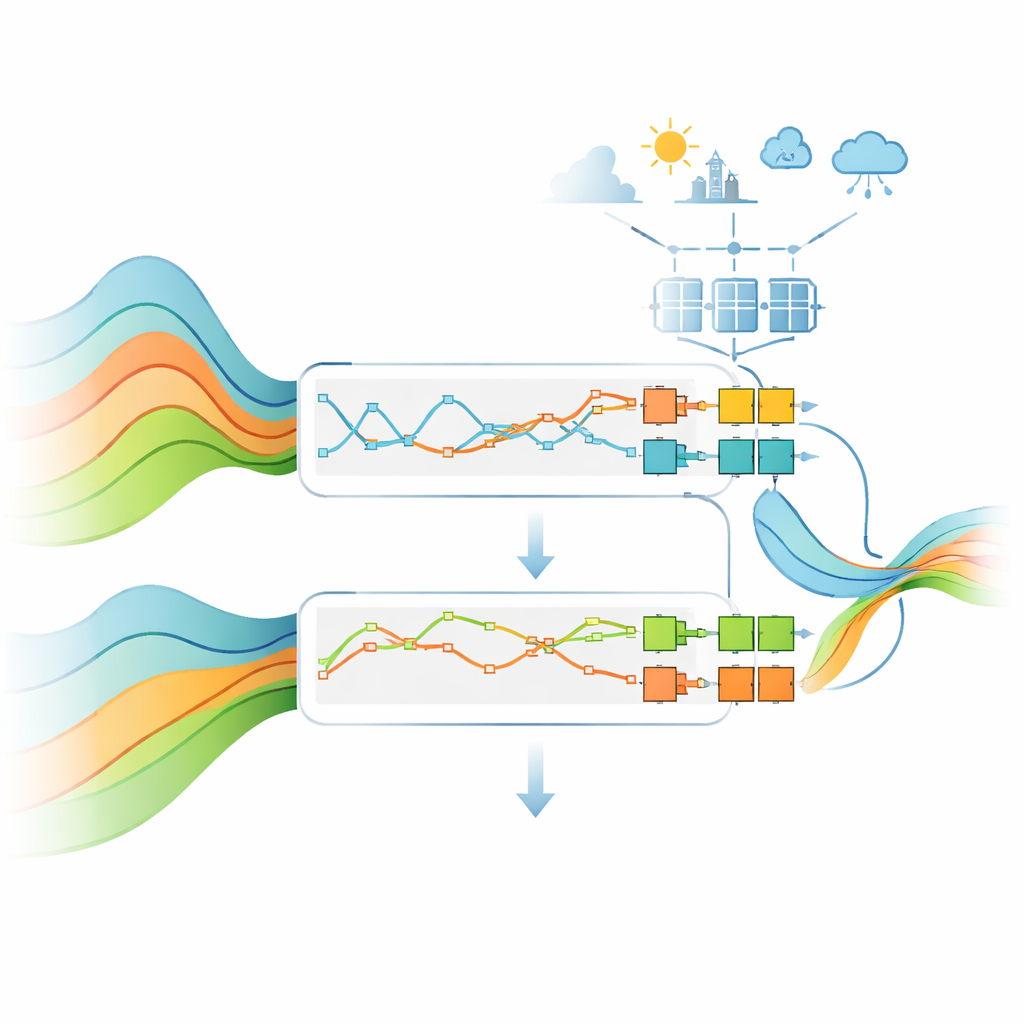
Mamba‑ECIS tackles this challenge by first fusing different streams of information into a single, time‑ordered picture of energy use. It combines high‑resolution consumption data with outside influences such as temperature, humidity, and electricity prices, as well as text‑like indicators of holidays or special events. Before learning, the system normalizes and transforms these inputs so they share a common scale. A neural network then learns to highlight the most informative pieces from each source, and a weighting step lets the model emphasize, for example, weather on hot summer days or price on peak‑price evenings. This produces a richer and more flexible description of how and why power is used.
Watching today’s spikes and tomorrow’s trends
To avoid confusing quick blips with deeper shifts, the model uses a dual‑branch design. One branch looks at high‑frequency data—the minute‑to‑minute or hour‑to‑hour ups and downs that matter for real‑time operations. The other branch focuses on slower, smoothed‑out patterns such as daily averages and seasonal cycles. Each branch has its own sequence‑modeling blocks, based on an efficient architecture known as Mamba state‑space models, which can handle very long histories without the heavy computation of classic attention‑based networks. A fusion layer then blends the two views, automatically adjusting how much weight to give short‑term versus long‑term signals depending on current conditions, such as a heatwave or a routine weekday.
Linking cause and effect, not just correlation
Beyond making accurate predictions, the authors want the system to say which factors actually drive changes in demand. For this, they add a causal attention module. It uses an attention‑style mechanism to measure how strongly each external factor is linked to consumption at each moment, then passes these relationships through a causal inference network that estimates each factor’s direct contribution. A separate weighting step lets the model adjust these contributions over time. This design does not claim to be a full formal causal theory, but it moves beyond mere pattern‑matching: grid planners can see, for instance, when temperature spikes or holiday schedules are chiefly responsible for a surge in usage, and plan marketing or demand‑response programs accordingly.
Putting the system to the test
The researchers evaluated Mamba‑ECIS on two widely used real‑world datasets: detailed household consumption records from Portugal and high‑resolution residential and commercial data from the United States. Both include millions of readings and rich contextual information. Across several standard error measures, the new model beat a range of strong competitors, including modern Transformers, other Mamba‑based models, and specialized time‑series networks. Typical gains of 3–12 percent in accuracy may sound modest, but they can translate into substantial savings and reliability improvements for utilities operating at national scale. Additional tests, where specific modules were removed, showed that multimodal fusion, the dual‑branch structure, and the causal attention gate each made distinct and complementary contributions to performance.
What this means for everyday power users
For non‑experts, the key message is that smarter, more transparent forecasting can help keep electricity systems both cheaper and more reliable. By weaving together many data sources, separating short‑term noise from enduring habits, and shining light on which outside forces truly drive demand, Mamba‑ECIS offers power companies a more trustworthy guide to the near future. That, in turn, can support fairer pricing, better targeted conservation programs, and fewer surprises during heatwaves and cold snaps—quietly improving how energy is produced, marketed, and used behind the scenes.
Citation: Pang, W., Wang, X. & Li, K. Mamba ECIS for power marketing customer behavior forecasting using multimodal deep learning. Sci Rep 16, 13063 (2026). https://doi.org/10.1038/s41598-026-43438-3
Keywords: electricity demand forecasting, smart grid analytics, multimodal deep learning, energy customer behavior, causal machine learning