Clear Sky Science · en
Hidden Markov model analysis of fluorescence blinking in fluorescently labeled DNA
Why tiny flashes of light matter
Inside modern biology labs, researchers often watch single DNA molecules by attaching a fluorescent dye that blinks on and off like a microscopic lighthouse. Those blinks carry rich information about how electrons move through DNA and how the local environment changes, but the signals are buried in noise from the microscope and the surroundings. This paper shows how a statistical tool from machine learning, called a hidden Markov model, can sift through that noisy flicker to reveal when the dye is truly on, when it is off, and how long each state lasts—turning messy light traces into clear physical insight.
Following a single glowing tag on DNA
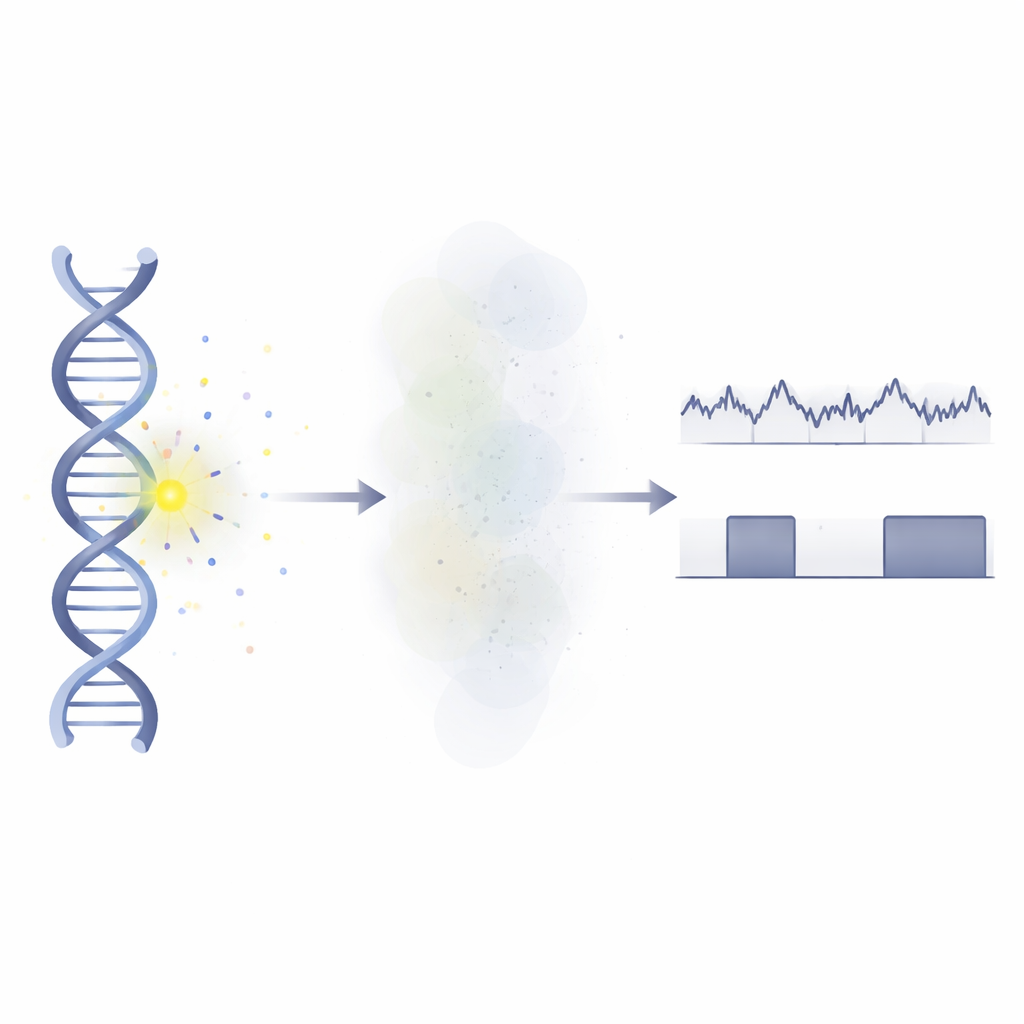
The study focuses on DNA strands tagged with a red fluorescent dye (ATTO655) at a specific site, along with a special base that can trap electrical charge. Under constant laser illumination, the dye alternates between an emitting “ON” state and a non-emitting “OFF” state. In the ON state, the dye repeatedly absorbs photons and re-emits them as fluorescence. In the OFF state, an electron has been transferred away, leaving the dye in a charge-separated configuration that cannot glow. When scientists record the number of photons arriving at the detector in very small time slices—here, half a millisecond—the result is a jagged time series in which high and low photon counts should reflect ON and OFF periods, but are heavily distorted by random fluctuations and background light.
Teaching a model to listen through the noise
To decode these flickering traces, the authors use a hidden Markov model (HMM), a framework well known in speech recognition and finance but still underused in materials science. In this context, the hidden states are simply ON and OFF, and the observed data are photon counts in each time bin. The team assumes that, once enough photons are collected per bin, the counts for each state can be approximated by smooth bell-shaped (Gaussian) distributions with different averages. Using a Bayesian sampling procedure that alternates between updating the hidden state sequence and the parameters describing those distributions and switching rates, the HMM learns, step by step, which segments of the trajectory most likely correspond to emitting or non-emitting DNA. The result is a much cleaner two-level state trace laid over the noisy photon record, along with estimated probabilities for transitions between ON and OFF.
Timing the bright and dark intervals
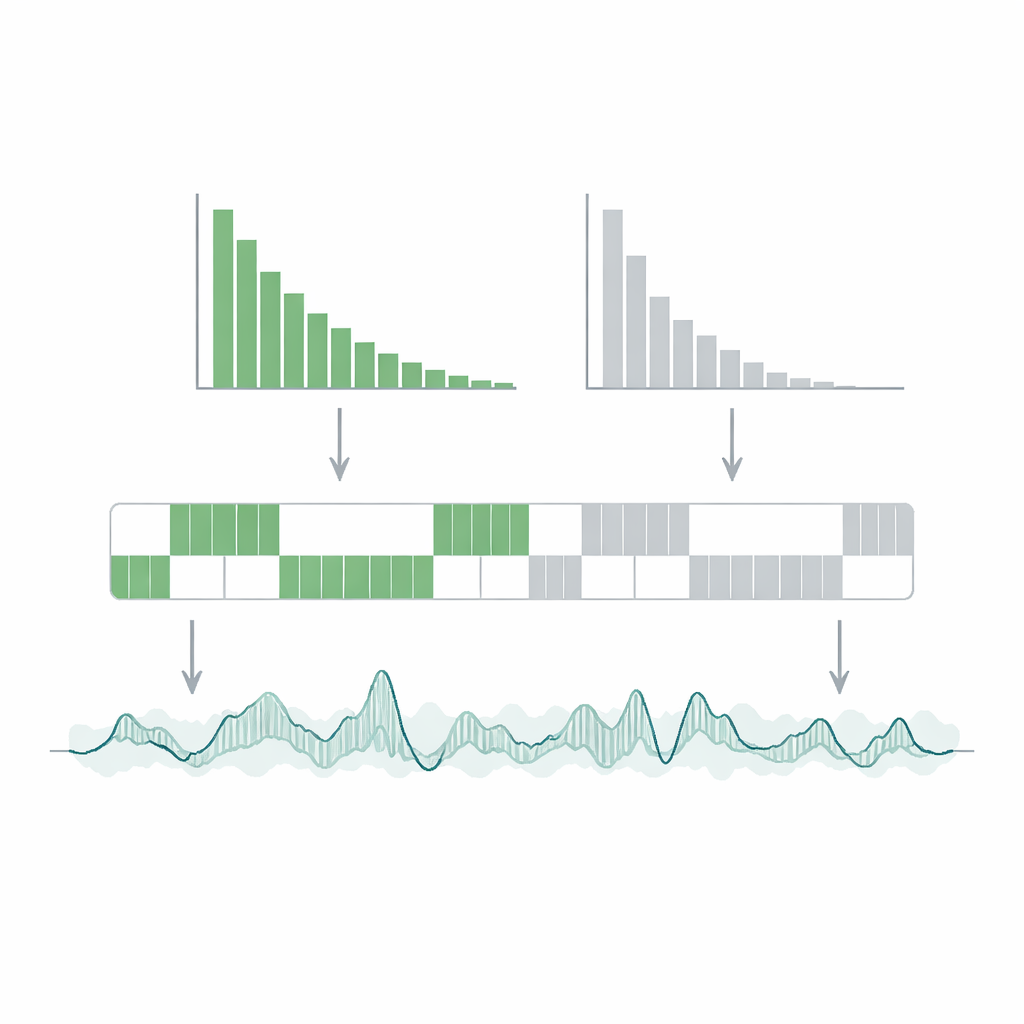
With a reliable state sequence in hand, the authors gather statistics on how long each ON or OFF episode lasts. They build “blinking plots,” which are probability distributions of dwell times in each state, and find that both ON and OFF durations follow simple exponential decays. From these curves they extract characteristic relaxation times: about 17.6 milliseconds for the ON state and 7.8 milliseconds for the OFF state. Compared with the intrinsic emission process of a single dye molecule, which happens on the scale of billionths of a second, these tens-of-milliseconds intervals are extremely long. The ON state is best thought of as a quasi-steady regime in which the dye undergoes many rapid absorption–emission cycles before a comparatively rare switch to the OFF state. The long OFF period points to a surprisingly stable charge-separated configuration in the DNA–dye system, implying that charge recombination—the return to the glowing state—is relatively slow.
When the data shape makes or breaks the analysis
Interestingly, the researchers find that the success of the HMM depends strongly on the shape of the photon-count histogram—the tally of how often each photon count occurs per time bin. When this histogram clearly shows two peaks, one for ON and one for OFF, the model recovers crisp state sequences. When the peaks merge into a single broad hump, state identification becomes much more ambiguous, even though overall averages like mean photon counts and event numbers are still captured correctly. The team shows that increasing the bin width in time tends to separate the ON and OFF distributions and produce two peaks, improving robustness, but at the cost of losing information about very short-lived events. They offer practical rules of thumb: the smallest reliably measurable state duration is several times the chosen bin width, and a visibly bimodal histogram is a good indicator that the analysis is trustworthy.
What this means for reading molecular flickers
By combining single-molecule fluorescence experiments with a carefully constructed hidden Markov model, this work turns noisy blinking from a nuisance into a quantitative probe of electron motion along DNA. The finding that OFF states last on the order of eight milliseconds shows that charge-separated states in this DNA–dye construct are unusually long-lived, while the roughly 18-millisecond ON periods reveal that many photons can be emitted before each dark spell. Just as important, the paper spells out how choices like time-bin width and signal quality govern whether such time-series analyses are reliable, offering a clear checklist for future experiments. Together, these advances bring researchers closer to reading the detailed electrical and structural behavior of biomolecules directly from their tiny flashes of light.
Citation: Furuta, T., Fan, S., Takada, T. et al. Hidden Markov model analysis of fluorescence blinking in fluorescently labeled DNA. Sci Rep 16, 11306 (2026). https://doi.org/10.1038/s41598-026-40876-x
Keywords: single-molecule fluorescence, DNA electron transfer, fluorescence blinking, hidden Markov models, photon counting