Clear Sky Science · en
Usmile likelihood evaluation provides robust threshold free assessment of binary classification models for balanced and imbalanced datasets
Why better model checks matter for everyday decisions
From medical tests to credit scoring, computers often answer yes-or-no questions: Does this patient have heart disease? Will this transaction be fraudulent? Yet the tools we use to judge how good these models are can be misleading, especially when the thing we are looking for is rare. This paper introduces a new way to check such models that looks separately at how well they find the important rare cases and how well they avoid false alarms, offering a clearer picture for high‑stakes decisions.
Limits of today’s one-number report cards
Most current model “report cards,” such as the popular ROC curve and its summary value, the area under the curve, boil performance down to a single number. That number mixes together success on people who truly have the condition (events) and on those who do not (non‑events). In many real problems, like medical diagnostics or fraud detection, the rare group is precisely the one we care about most, and its mistakes are much more costly than errors in the common group. Under strong imbalance—when there are many more non‑events than events—traditional measures can suggest a model looks very good even though it performs poorly for the rare, critical cases.
A new "smile-shaped" view of model strength
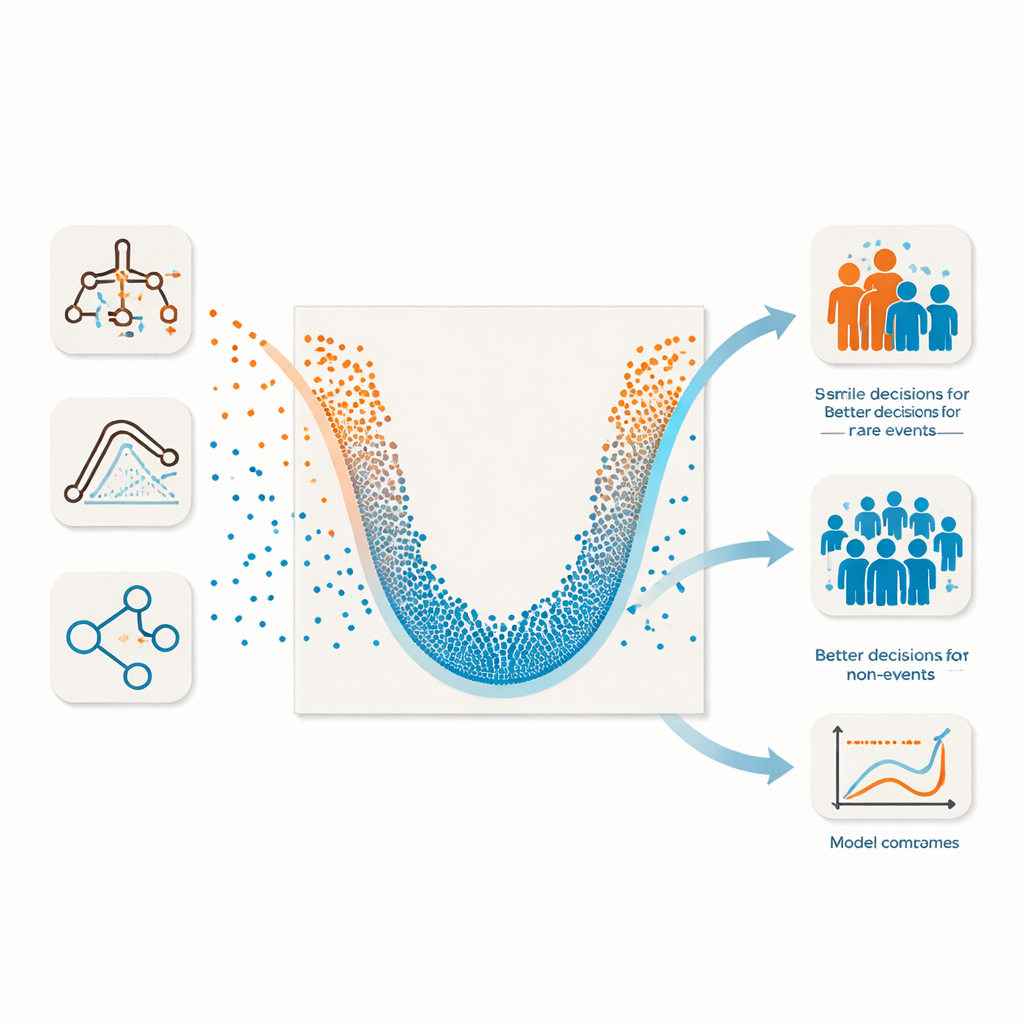
The authors extend their earlier U‑shape visualization idea into a full method called U‑smile Likelihood Evaluation. At its core is a new score, the relative likelihood ratio, which compares how much more likely the data are under a given model than under a simple reference model with no useful information. This score is naturally threshold‑free: it uses the raw predicted probabilities rather than forcing the user to pick a cut‑off. Crucially, it is broken down into separate pieces for the event and non‑event groups. On a U‑shaped plot, improvements for each group are shown by colored points: a deep, symmetric “smile” means the model helps both groups; a lopsided shape reveals when only one group benefits. Point size reflects how many individuals are affected, and line style marks whether the improvement is statistically reliable.
How the method behaves on balanced and skewed data
To test their approach, the researchers created several synthetic datasets that mimic different real‑world challenges: weak and strong signals, as well as strongly imbalanced situations where only one in ten cases is an event. They also analyzed a well‑known heart disease dataset. For each setting they built models step by step, adding one predictor at a time using either traditional ROC‑based rules or the new U‑smile criteria. In balanced situations, all methods chose similar predictors and reached nearly identical performance, suggesting that U‑smile is at least as good as existing practices when the data are well behaved. The real differences emerged under imbalance: there, U‑smile‑guided selection improved detection of the minority class by up to 16% in precision‑recall area and 21% in F1 score compared with ROC‑guided selection, while keeping performance for the majority class strong.
Seeing what each predictor really contributes
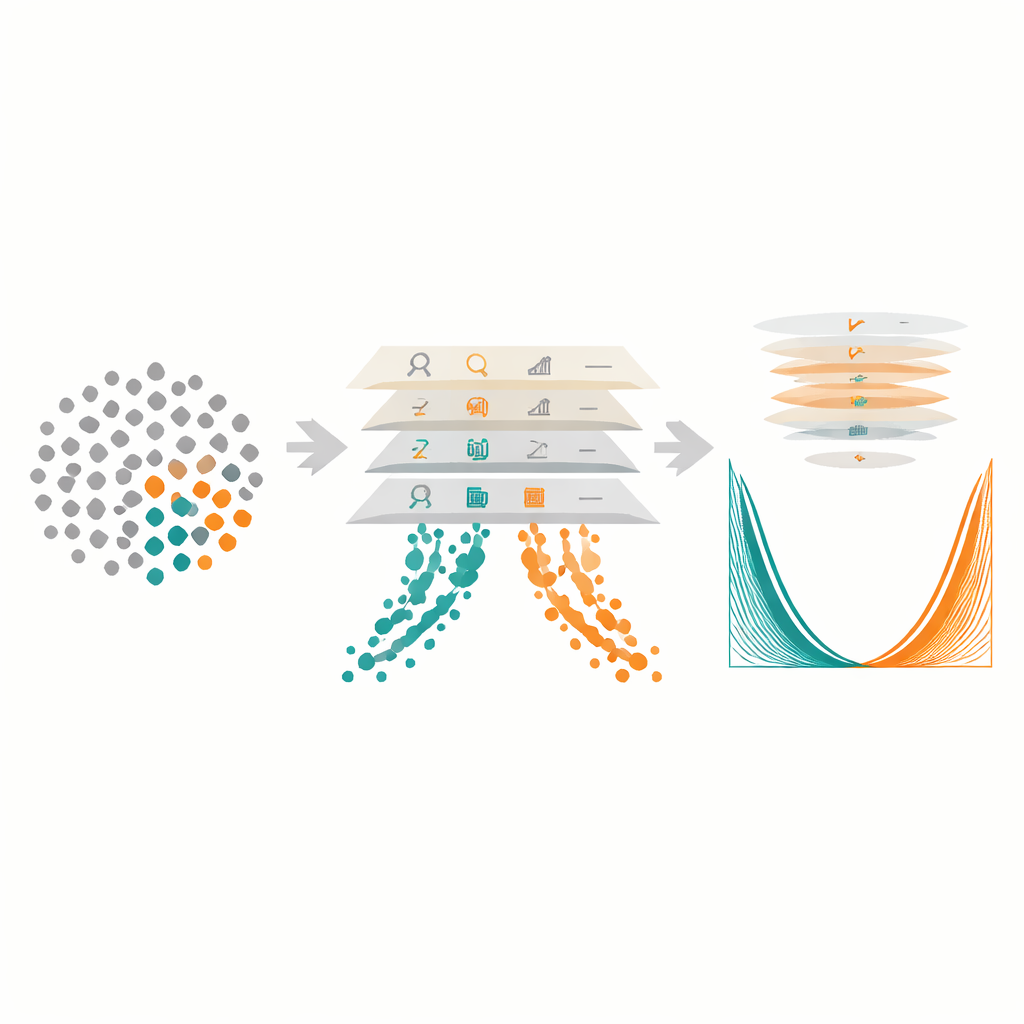
Because U‑smile plots can be drawn after each modeling step, they double as a visual logbook of how a model grows. In the imbalanced examples, early predictors mainly improved recognition of event cases, giving a skewed smile. Later predictors restored balance, deepening and symmetrizing the curve. Separate versions of the method can deliberately favor either events or non‑events, allowing users to tailor models to specific goals—for example, maximizing detection of rare disease while another version emphasizes avoiding unnecessary alarms. The authors also applied the method to random forest models, which operate very differently from classical logistic regression, and found that the same U‑shaped patterns still provided clear insights, showing that the approach works across many kinds of algorithms.
What this means for real-world risk decisions
In plain terms, the study offers a clearer, more honest way to ask: “Who is this model really helping?” Instead of a single flattering score, U‑smile Likelihood Evaluation shows, at a glance, whether a model truly improves detection of rare but important events, how much it benefits common cases, and which added predictors drive those changes. For domains such as medicine, sports, finance, and industrial safety—where missing a rare event can be far more serious than raising an occasional false alarm—this class‑by‑class view can guide better model design and more transparent communication about risk.
Citation: Więckowska, B., Guzik, P. Usmile likelihood evaluation provides robust threshold free assessment of binary classification models for balanced and imbalanced datasets. Sci Rep 16, 10000 (2026). https://doi.org/10.1038/s41598-026-40545-z
Keywords: binary classification, imbalanced data, model evaluation, likelihood ratio, explainable machine learning