Clear Sky Science · en
Analysis of the movement of permanent GNSS stations in Spain with directional statistics
Why tiny shifts in Spain’s ground matter
Even when we feel solid ground beneath our feet, the land is slowly on the move. This study shows how a web of satellite-linked sensors spread across Spain can detect motions as small as a few micrometers per day—fractions of the width of a human hair. By turning these subtle shifts into easy-to-read graphics, the authors reveal how Spain rides along the Eurasian tectonic plate, drifting a couple of centimeters northeast each year, and they demonstrate open tools that make this kind of analysis more accessible beyond specialist statisticians.
Listening to satellites watch the ground
Modern navigation systems such as GPS, Galileo, GLONASS and BeiDou are best known for guiding cars and smartphones, but the same signals also allow scientists to track the precise position of fixed receivers on the ground day after day. Spain hosts a dense network of such permanent stations, many of them part of the European EUREF system, which provides high-precision, long-term records of how each site’s position changes over time. These data are invaluable for monitoring the stability of buildings and bridges, checking national mapping systems, and, crucially, tracing how tectonic plates shift across the globe.
Turning circular motion into clear patterns
The authors focus on the direction of station movements rather than just their size, using a branch of statistics designed for angles, known as circular or directional statistics. Instead of treating positions as points along a straight line, they imagine each daily motion as an arrow on a circle, characterized by its direction and length. With an open-source Python library called PyCircularStats and related tools, they convert latitude–longitude readings into a flat map projection and compute, for every station, thousands of tiny daily displacement vectors. These are then combined in several ways to reveal long-term trends, all while providing visual diagrams that let researchers see at a glance whether movements line up in a common direction or scatter randomly.
Three ways to measure a slow drift
To describe how each station moves over years to decades, the team tests three complementary strategies. One simply adds up all the daily motion arrows to obtain the net shift from the start of the record to the end. A second strategy compares the average position during the first two weeks of data with the average during the last two weeks, filtering out short-term noise. A third divides the total shift by the number of measurements to estimate an average daily motion that should be comparable between stations with different data spans. By examining how these approaches agree, and by checking for outliers or gaps documented in station logs, the researchers ensure that unusual jumps—such as those caused by equipment changes or station relocation—do not masquerade as genuine tectonic movement.

Spain’s steady slide to the northeast
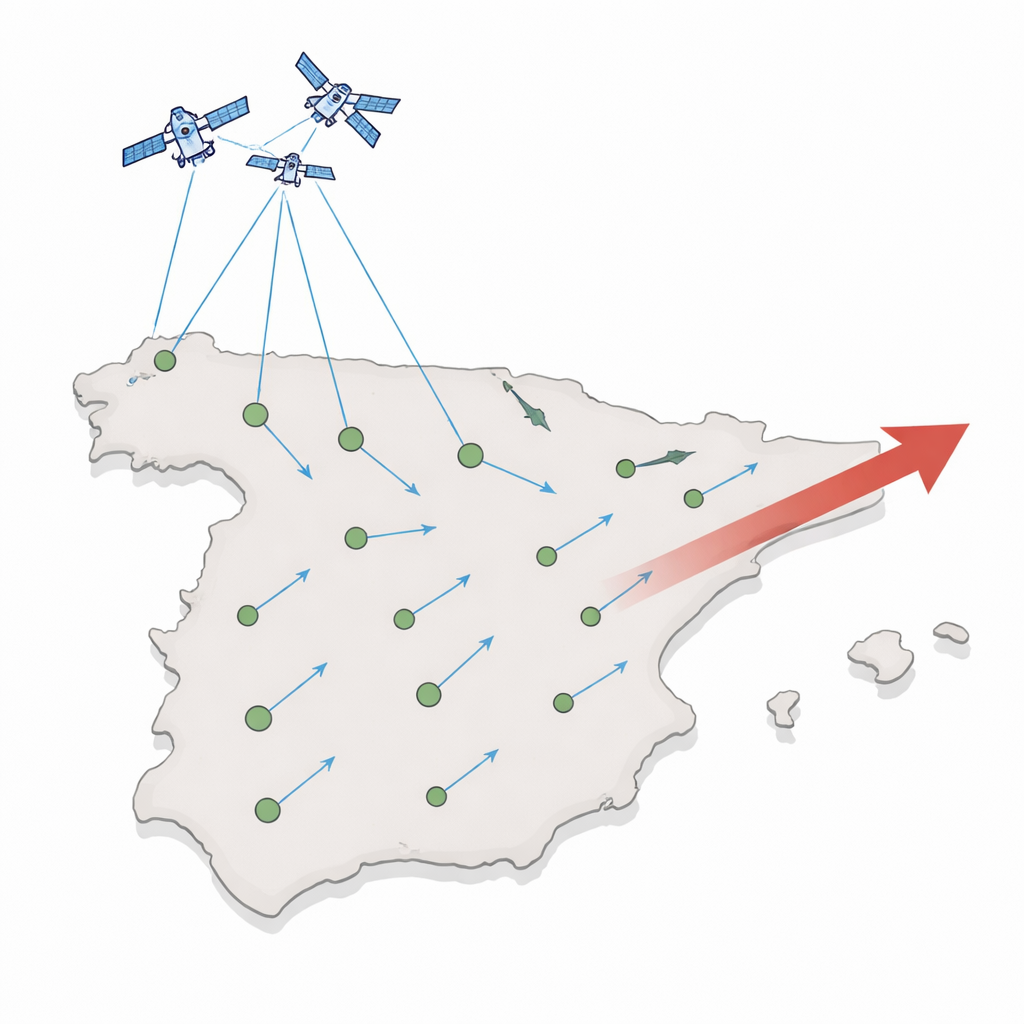
Across 27 long-running stations scattered over mainland Spain and nearby territories, the results tell a remarkably consistent story. Nearly all sites creep in a northeastward direction, with daily motions around 69 micrometers—adding up to about 2.5 centimeters per year—at an angle just over 41 degrees from due east. A few stations show odd behavior, often linked to known interruptions or hardware changes, but once these are accounted for, the pattern matches independent velocity estimates published by EUREF with typical differences of only about 1 percent. Circular plots make the behavior easy to see: clouds of tiny blue arrows representing daily movements cluster around a single red arrow that marks the long-term trend.
What this means for our moving continent
For non-specialists, the key takeaway is that Spain is not standing still: it rides smoothly with the Eurasian plate, sliding a couple of centimeters northeast each year, in line with broader plate-tectonic models. This shift is far too small to feel day to day, but it matters for ultra-precise mapping, long-term infrastructure monitoring, and understanding earthquake hazards. By combining satellite navigation data with user-friendly, open statistical tools and clear graphics, the study shows how anyone with the right data and software—not just experts with proprietary programs—can explore how our planet’s surface is constantly, if quietly, on the move.
Citation: Broncano, F., Cuartero, A., Rodríguez, P.G. et al. Analysis of the movement of permanent GNSS stations in Spain with directional statistics. Sci Rep 16, 11295 (2026). https://doi.org/10.1038/s41598-026-39548-7
Keywords: GNSS, tectonic plate motion, Spain geodesy, circular statistics, EUREF stations