Clear Sky Science · en
Detection of disturbances and cyber-attacks in smart grids using explainable machine learning
Why keeping the lights on now depends on data
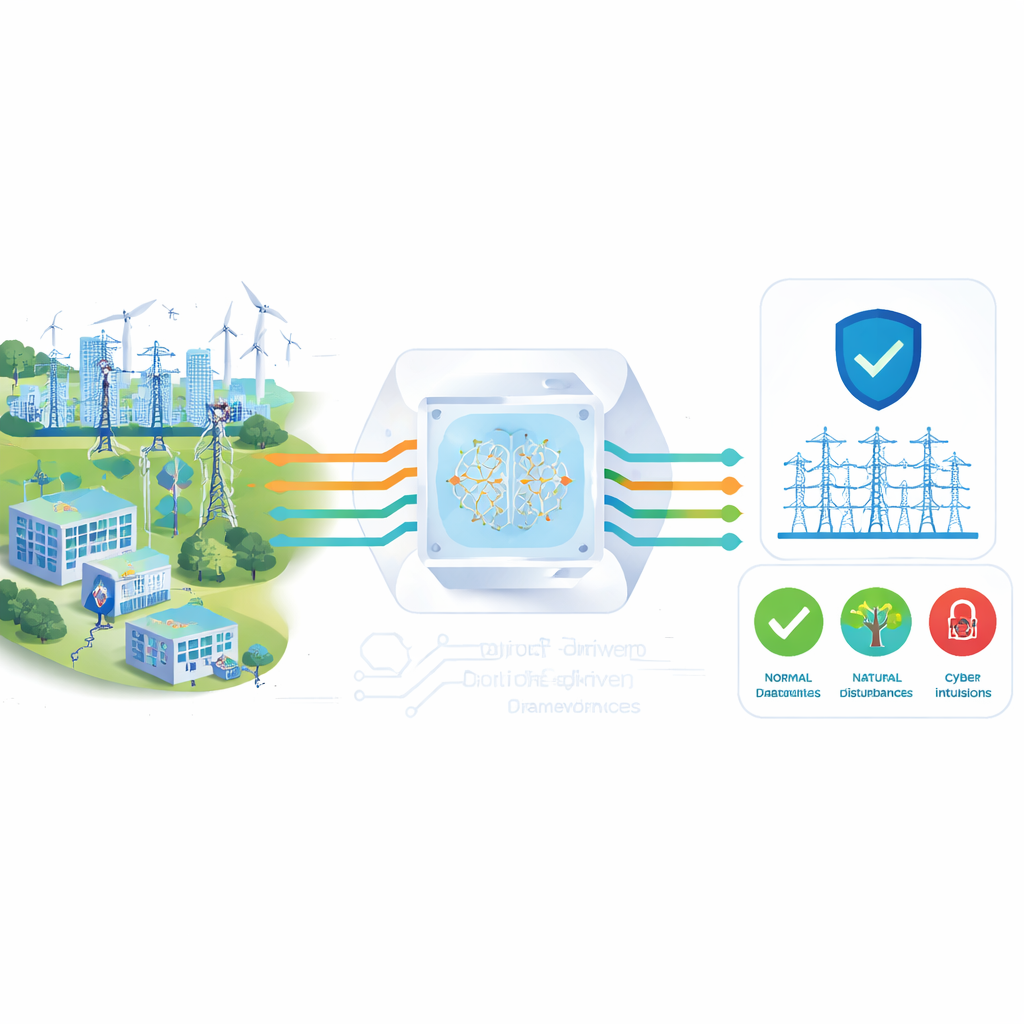
Electric power grids are no longer just metal towers and spinning turbines. They are deeply digital systems, packed with sensors and computers that keep electricity flowing smoothly. This digital nervous system also opens new doors for hackers, while storms, equipment failures, and human mistakes still threaten the physical network. This paper explores how a single, explainable machine-learning framework can watch over the grid, spot both natural problems and cyber-attacks, and show operators clearly why it is sounding the alarm.
One nervous system, many kinds of trouble
Modern “smart grids” blend operational technology that moves electrons with information technology that moves data. Sensors along high‑voltage lines measure voltages, currents, and frequencies dozens of times per second. Control panels log switch operations, and network monitors flag suspicious traffic. In the real world, a line shorting to ground and a well-crafted data‑forgery attack can look confusingly similar in these streams. Traditional protection systems mostly treat hardware faults and cyber incidents as separate problems, often using hard‑to‑interpret black‑box models. The authors argue that what operators really need is a unified view that can tell normal operation, natural disturbances, and malicious behavior apart in real time—and explain its reasoning.
Teaching machines to recognize grid “stories”
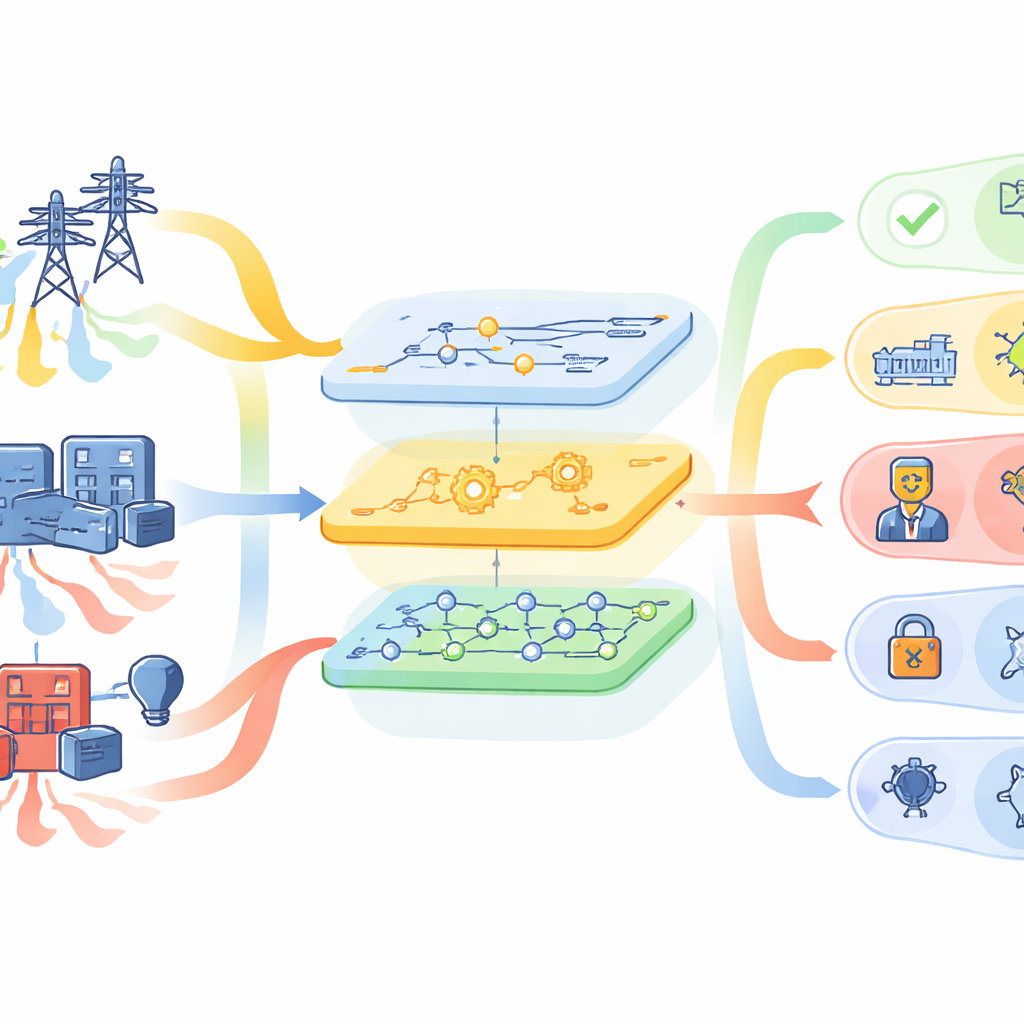
The study builds on a rich public dataset from a high‑fidelity testbed created by Oak Ridge National Laboratory and partners. The test system simulates a transmission grid under 37 detailed scenarios, including line faults, maintenance, normal conditions, and several cyber‑attack styles such as false data injection, replayed relay logs, and remote tripping commands. Each recorded event bundles together 128 synchronized measurements from different sources: fast sensor readings, relay logs, network intrusion alerts, and control actions. The researchers treat each event as a kind of short story told through time—how voltages, currents, and logs evolve together when something goes wrong.
From raw signals to clear decisions
To turn these stories into reliable warnings, the framework follows a carefully staged pipeline. First, it cleans the data by filling in missing values, taming outliers, and scaling measurements so that no single feature dominates just because of its units. Next, it trims away redundancy using several feature‑selection strategies, including random‑forest importance, principal component analysis, recursive elimination, and mutual information. This step aims to keep only the measurements that truly help distinguish one type of event from another, which speeds up learning and can improve accuracy. The refined data then feed a family of machine‑learning models—such as random forests, gradient boosting, support vector machines, and neural networks—whose settings are automatically tuned by an optimization tool called Optuna to strike the best balance between speed and correctness.
Seeing inside the black box
High accuracy alone is not enough when decisions affect a national grid. Operators must trust and understand why an algorithm says “this is a cyber-attack” instead of “this is a storm‑driven fault.” To open this black box, the authors use an explainable‑AI technique known as permutation SHAP. In essence, it measures how much each feature—such as a specific voltage phase angle or a particular current reading—contributes to the final decision by shuffling it and seeing how the model’s performance changes. Across both medium‑level (three‑class) and fine‑grained (37‑class) tasks, the method highlights a consistent set of key measurements: certain voltage phase angles, voltage magnitudes, and zero‑sequence currents from a handful of strategically placed sensors. These align well with power‑system physics, giving human experts confidence that the model is “looking” at the right parts of the grid.
How well it works in practice
The framework is tested in three increasingly demanding settings: separating attacks from non‑attacks (binary), distinguishing attacks, natural events, and no‑event periods (three‑class), and pinpointing which of 37 specific scenarios is occurring (multi‑class). For individual datasets focused on particular grid conditions, the best models routinely exceed 96% in precision, recall, F1‑score, accuracy, and specificity. Even when many scenarios are pooled together to mimic more varied real‑world conditions, the average performance stays above 93%. Inference—the time needed to classify a new event—is under a tenth of a second per sample on standard hardware, fast enough for typical grid‑control time scales. More expensive steps such as hyperparameter search and detailed SHAP analysis are done offline, so they do not slow real‑time monitoring.
What this means for future power grids
For non‑specialists, the takeaway is that this work offers a practical, transparent early‑warning system for smart grids. By fusing many kinds of sensor and log data, the framework can tell whether a disturbance is a normal fault, a harmless operating change, or a stealthy cyber‑attack designed to look natural—and it can show which measurements drove that judgment. While the authors note open challenges, such as coping with entirely new attack types and shifting operating conditions, their results suggest that explainable machine learning can become a core tool for keeping tomorrow’s highly digital power systems both reliable and secure.
Citation: Farsi, M., Alwateer, M., Alsaedi, S.A. et al. Detection of disturbances and cyber-attacks in smart grids using explainable machine learning. Sci Rep 16, 9834 (2026). https://doi.org/10.1038/s41598-026-35449-x
Keywords: smart grid security, cyber-physical attacks, intrusion detection, explainable AI, power system monitoring