Clear Sky Science · en
City-scale high-resolution traffic datasets with refined networks for hierarchical traffic control
Why city traffic needs better data
Anyone who has sat through a string of red lights or crawled along a clogged downtown street has felt how messy city traffic can be. Yet most of the systems that control those lights and manage flows still rely on incomplete, low-detail data. This paper introduces a new family of city-scale traffic datasets designed to give researchers and planners a much clearer picture of how vehicles actually move through real road networks, opening the door to smarter, more coordinated control of congestion.
From a few streets to whole cities
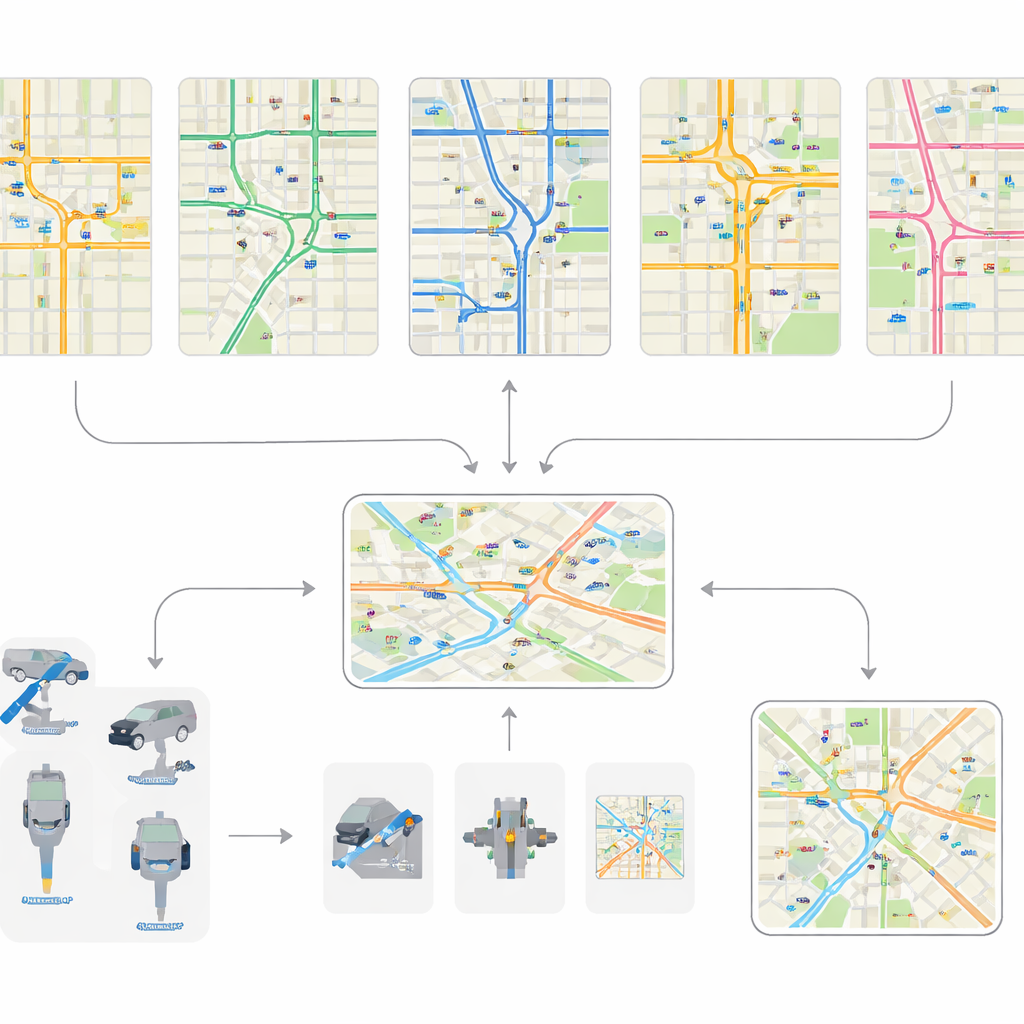
The authors assemble and standardize detailed traffic data from five very different urban areas: Jinan, Hangzhou, Manhattan, Nanchang, and Xuancheng. These cities span everything from short arterial corridors with just a dozen intersections to vast networks with thousands of junctions. Earlier open datasets typically focused on small, neat grids and brief one-hour snapshots. By contrast, this collection captures a wide variety of road layouts, intersection shapes, and demand patterns. One of the standout contributions is the Xuancheng dataset, which represents nearly an entire city with hundreds of intersections modeled at fine detail, including how individual lanes are arranged and how complex intersections are structured.
Seeing every car, not just a sample
Most existing traffic data come from cameras or sparse sensors, which only glimpse parts of the network and for short periods. The Xuancheng data take a different approach. The city has an automatic vehicle identification (AVI) system installed at key road segments, recording when each vehicle enters and leaves. By matching anonymous identifiers from entry and exit records, the authors reconstruct full paths for hundreds of thousands of trips per day over an entire month. This allows them to see how drivers actually choose routes, how flows change between weekdays and weekends, and how holidays reshape demand. Vehicles are also classified into broad types, such as passenger and freight, so simulations can reflect how different kinds of vehicles affect traffic.
Turning messy records into a common map
Because the five cities’ raw data were stored in different formats and levels of detail, the team developed a unified processing workflow. First, they rebuild each road network as a consistent digital map, identifying intersections and connecting roads even when the original sources use different geometry definitions. They estimate intersection size and position by enclosing raw shapes in simple rectangles and align approaches with cardinal directions using an optimization method. Next, they standardize traffic signals by defining a small set of typical movement patterns—such as left turns or straight movements along each corridor—and automatically matching each real intersection to these patterns. Finally, they construct vehicle flows and clean the data: implausible routes are removed, missing segments are inferred from the network, and continuous trips are assembled from many short sensor readings.
From single cars to whole networks
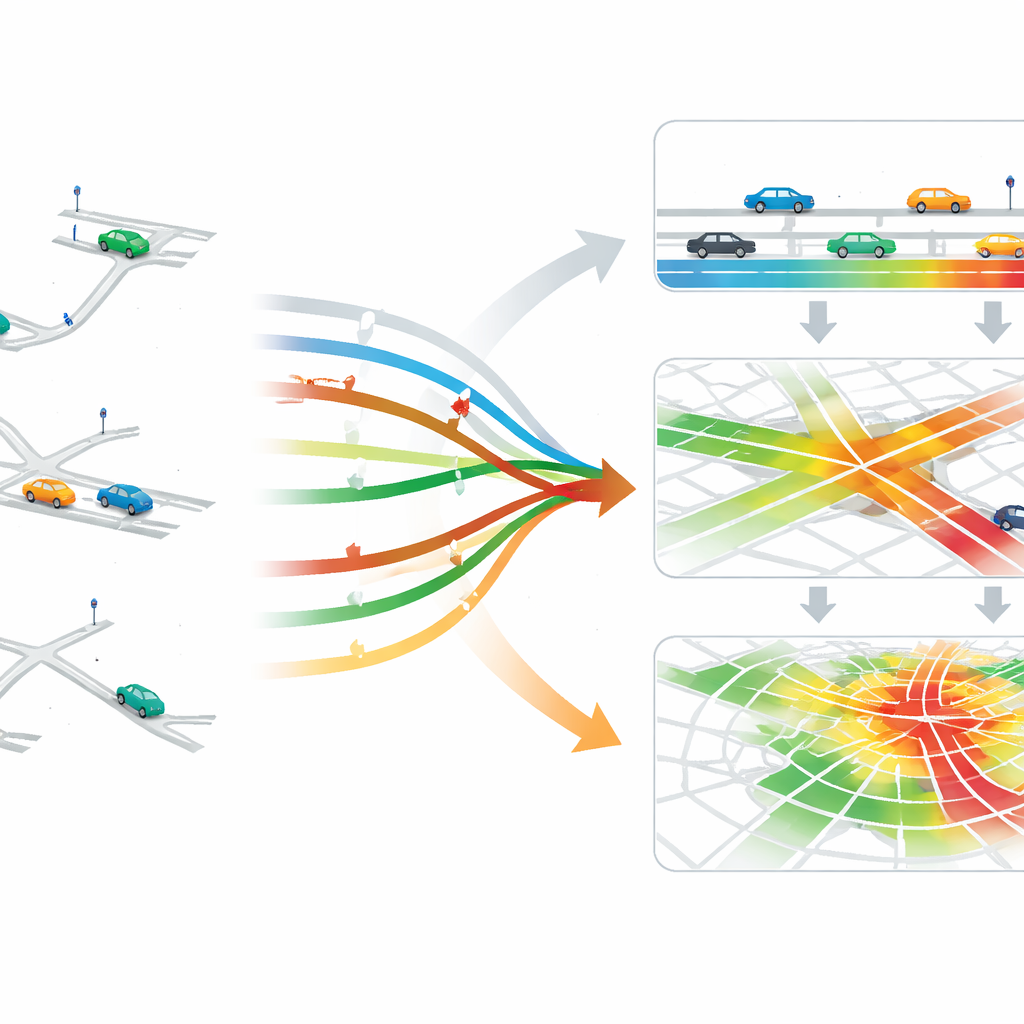
Once trips and networks are in place, the authors generate traffic "state" data at three levels. At the most detailed level, they track individual vehicles, including their positions and speeds, which can be used to test ideas like smoother routing or vehicle platoons. At the intermediate level, they summarize conditions on each lane and intersection, such as queues and densities—information crucial for tuning traffic signals. At the broadest level, they aggregate conditions across whole areas of the city, supporting strategies that regulate how many vehicles are allowed into a congested region. All of this is packaged in a common simulation format (CityFlow), so that different control methods can be tested fairly and efficiently.
Checking that the digital city matches reality
To make sure their reconstructed world resembles the real one, the researchers validate both the maps and the trips. They compare the converted road network against original geographic data and find that most connections and positions are preserved within just a few meters. For trips, they simulate vehicles along a selected road and compare travel times with real measurements; the averages are very close, with small differences explained by factors like drivers occasionally exceeding speed limits in the real world. They also show that the derived state data can support advanced strategies: using lane-level information to apply a pressure-based signal control, then adding citywide "perimeter" control to prevent a core area from overloading, and finally demonstrating that rerouting a single vehicle based on this information can cut its travel time in heavy traffic.
What this means for everyday drivers
For non-specialists, the significance of this work lies less in the algorithms and more in the foundation it provides. By releasing detailed, well-validated, and openly documented datasets, the authors give traffic engineers and AI researchers a realistic playground to design and test new control schemes before they touch real streets. With accurate representations of how roads are laid out, how signals operate, and how demand rises and falls over days and weeks, future tools can be tuned to reduce delays, save fuel, and make city travel more predictable. In short, these datasets are an essential stepping stone toward traffic systems that respond to real-world complexity rather than idealized models.
Citation: Ma, Q., Guo, X., Zhong, W. et al. City-scale high-resolution traffic datasets with refined networks for hierarchical traffic control. Sci Data 13, 547 (2026). https://doi.org/10.1038/s41597-026-06892-2
Keywords: urban traffic data, hierarchical traffic control, traffic simulation, automatic vehicle identification, city-scale mobility