Clear Sky Science · en
Global dataset on heat wave exposure due to the urban heat island effect
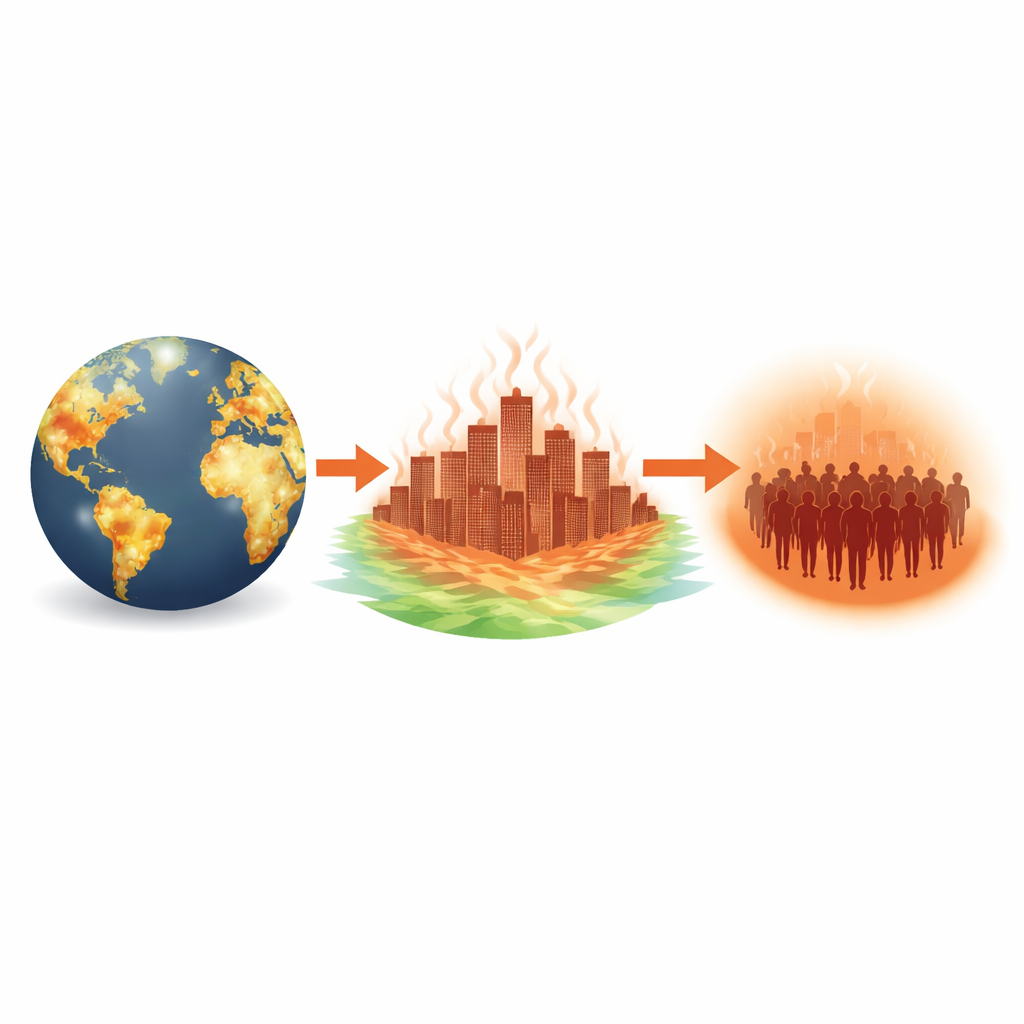
Why city heat matters to everyday life
Searing summer days are becoming more common, and for people who live in cities this heat can feel especially intense. Concrete and asphalt trap warmth, tall buildings block breezes, and millions of people are packed into small areas. This study tackles a simple but vital question: how much extra heat-wave exposure do city dwellers suffer specifically because cities are hotter than their surroundings, and how is that changing over time around the world?
Hotter cities in a warming world
Global warming and rapid urban growth are working together to raise heat risks. Between 2000 and 2019, nearly half a million people died each year worldwide from temperature-related causes, and rare, once-in-a-century deadly heat events are already becoming much more frequent. Cities, which form what scientists call urban heat islands, tend to be several degrees warmer than nearby countryside. That added warmth can turn an already hot spell into a dangerous heat wave for millions of residents, making it crucial to understand not just how often heat waves occur, but how much of that danger stems from the city environment itself.
Building a worldwide heat-exposure map
To answer this, the authors created a global dataset at a fine, one-kilometre scale that tracks how many days people are exposed to heat waves in urban areas from 2003 to 2020. They combined satellite-based land surface temperatures, detailed maps of where people live, and consistent global outlines of city boundaries. Instead of using a single temperature cutoff everywhere, they defined heat waves relative to each region’s usual climate: if local temperatures exceeded the top 10 percent of historical values for at least three days in a row, those days counted as a heat wave. This approach captures what feels extreme in both cool and hot climates, making the results meaningful across very different regions.
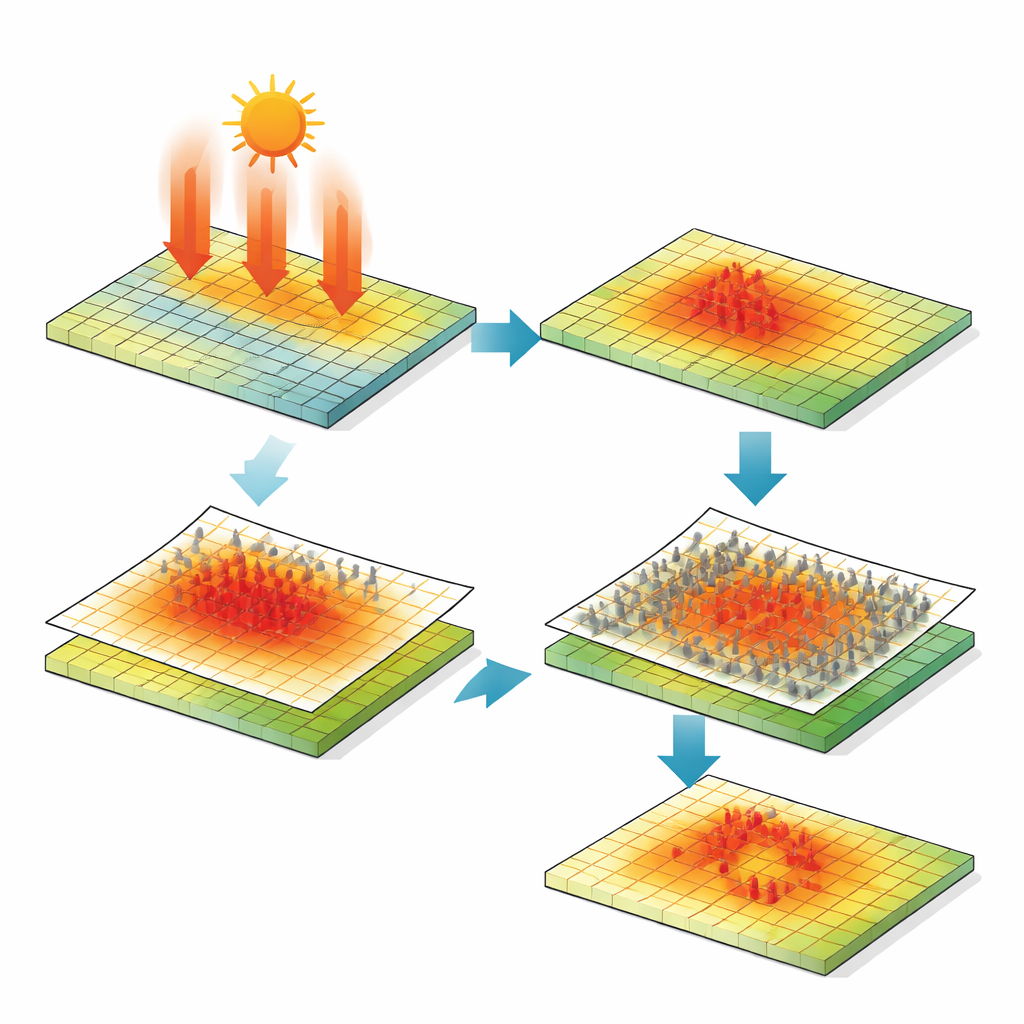
Separating city heat from background climate
A key innovation of the work is teasing apart how much heat-wave exposure is due to broad-scale climate versus the added warming from cities themselves. The team first identified each city’s built-up core using a global urban boundary dataset. Around each core, they created a surrounding ring of nearby land with the same overall area, treating this as the reference background. By carefully adjusting the size of this ring for each city, they ensured it mainly consisted of natural or lightly developed land rather than other urban zones. Comparing heat-wave days inside the city with those in the surrounding ring allowed them to estimate the extra hot days caused by the urban heat island effect, and then to multiply those days by local population to calculate additional exposure in person-days per year.
What the maps reveal about who is at risk
The resulting global maps show where and how much urban heat islands are amplifying dangerous heat. In many major city regions, such as the Yangtze River Delta, São Paulo, New York, and London, the area affected by heat waves linked to urban conditions expanded notably between 2005 and 2020. Regions like East Asia and the Pacific stand out with particularly high added exposure, reflecting both dense populations and strong city warming. Other regions, including Europe, North America, Latin America, the Middle East and North Africa, and Sub-Saharan Africa, also saw increases in heat-wave exposure due to city growth and more paved surfaces, while some parts of South Asia showed decreases linked to shifting climate and population patterns. The authors also checked that the satellite temperature data closely track air temperatures measured at weather stations worldwide, giving confidence that the patterns they see reflect conditions people actually experience.
Tools for safer and more sustainable cities
For non-specialists, the central message is that cities are not just passive victims of global warming; their design and expansion can strongly amplify or ease heat risks. This open, freely available dataset lets planners, health officials, and researchers pinpoint where urban design changes—such as more parks, reflective roofs, or different building layouts—could most effectively cool neighbourhoods and reduce illness and death during heat waves. By separating the influence of overall climate from the added effect of city structures, the work provides a clear, data-driven foundation for targeting heat-mitigation efforts and for building early-warning systems that better protect urban residents as the planet continues to warm.
Citation: Yu, W., Yang, J., Zhou, Y. et al. Global dataset on heat wave exposure due to the urban heat island effect. Sci Data 13, 449 (2026). https://doi.org/10.1038/s41597-026-06877-1
Keywords: urban heat island, heat waves, climate risk, city planning, population exposure