Clear Sky Science · en
Machine learning estimates for G20 subnational urban GHG emissions from 2000–2020
Why City Emissions Matter to Everyone
Cities and regions are on the front lines of climate change, promising deep cuts in greenhouse gas pollution. Yet for most of them, we simply do not know with confidence how much they emit each year. This study tackles that blind spot by using modern machine learning to estimate annual climate-warming emissions for thousands of urban areas across the world’s largest economies, giving citizens, planners, and policymakers a clearer picture of where progress is happening—and where it is not.
The Growing Promise and Data Gap
Over the past decade, thousands of local governments have pledged climate action, and many have announced net-zero targets. But fewer than one in ten have regularly reported detailed emissions inventories over time. When cities do report, their methods differ, the sectors they include vary, and some count only emissions within their borders while others include what is consumed elsewhere. Traditional workarounds, such as simply scaling national emission totals down to cities using population or income, miss local efforts and obscure real change. Other gridded global datasets offer consistency but do not match the actual boundaries where local leaders make decisions, limiting their usefulness for real-world planning.
A New Map Built by Machines
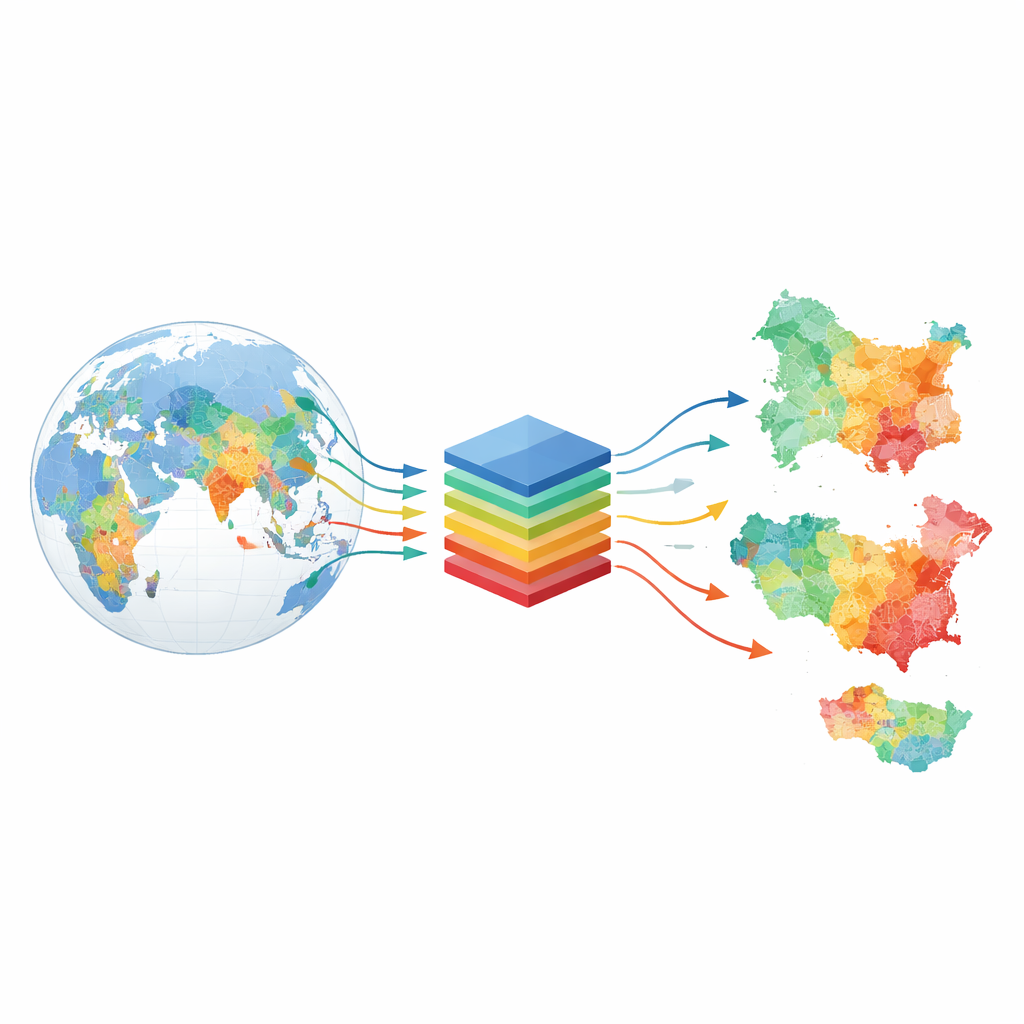
The authors build a machine learning framework to estimate yearly greenhouse gas emissions from 2000 to 2020 for nearly 6,000 cities and more than 100 regions in the G20 countries, which together account for about 80% of global emissions. They gather thousands of self-reported inventories from climate networks and government platforms, then carefully clean and standardize them—checking for duplicate entries, implausible per-person values, sudden spikes or drops, and inconsistent units. Each city or region is matched to an official administrative boundary using the Global Administrative Areas Database, so that predictions line up with real-world jurisdictions such as provinces, states, counties, and municipalities.
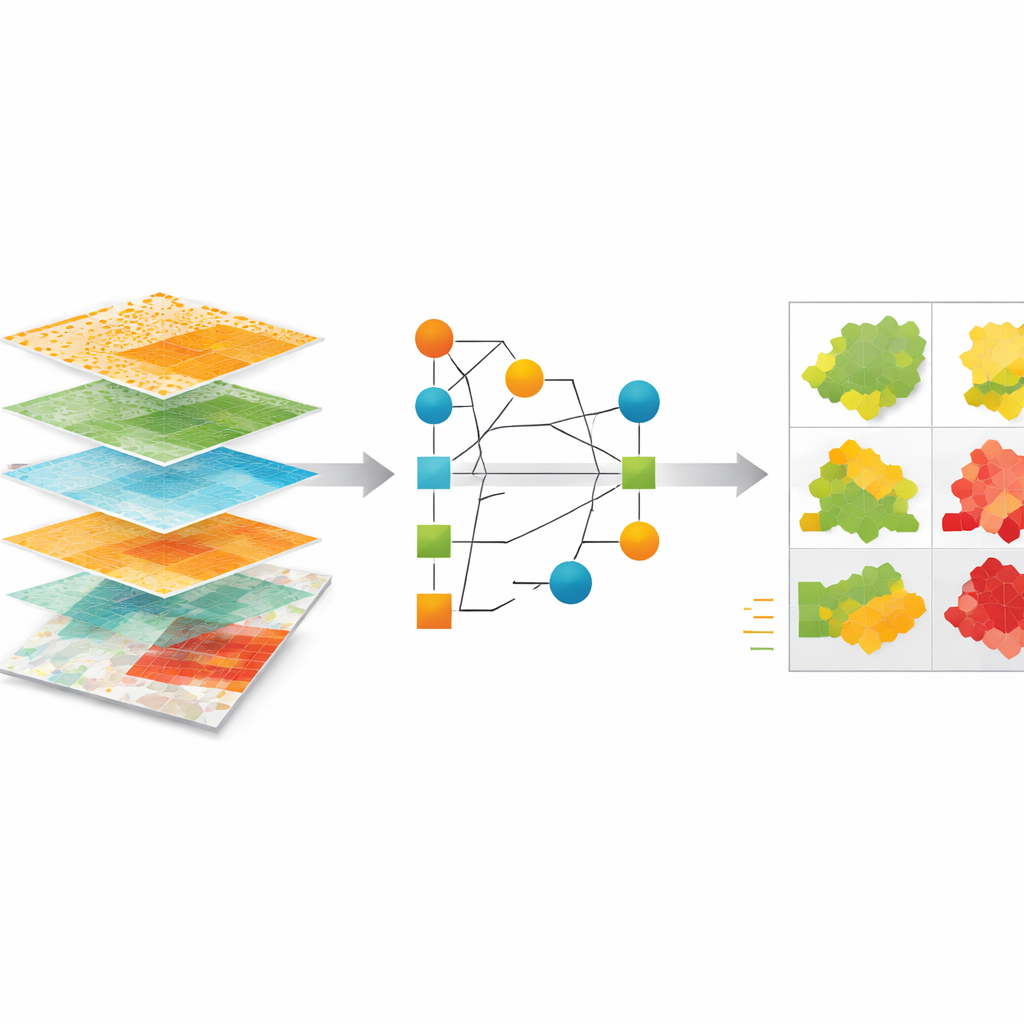
Feeding the Model with Clues from Space and Society
To teach the model how different places emit, the team pulls in a wide range of publicly available data. These include satellite-based estimates of fossil fuel emissions, sector-specific emission maps, electricity use, and air pollution such as fine particles and nitrogen dioxide. They add socioeconomic indicators like population and gross domestic product, as well as climate-related measures such as heating and cooling needs derived from weather data. Using zonal statistics, they summarize all these layers within each city or regional boundary and feed them into an automated machine learning system called AutoGluon. This system tests and combines multiple underlying models to best predict the emissions that cities have reported themselves.
How Well the Estimates Perform
On the emissions data reserved for testing, the model explains most of the variation between different places, with population and income emerging as the most influential drivers, followed by building emissions and electricity use. The researchers also compare their estimates to two independent datasets that use other methods to derive city-level or gridded emissions. Agreement is strongest for larger administrative areas and remains reasonably good at finer scales, though differences grow where input data are sparse or sector coverage is incomplete. By constructing uncertainty ranges around each prediction and examining how different model components disagree, the authors show that the largest uncertainties cluster in regions with the weakest reporting, particularly parts of the Global South.
What This Means for Climate Action
The end product is a publicly available dataset of yearly emissions for thousands of subnational governments across G20 countries from 2000 to 2020, along with the trained model so others can extend it. These estimates are not meant to replace local inventories produced by cities themselves but to act as a consistent baseline where such inventories are missing, patchy, or not comparable. For residents, advocates, and decision-makers, this means they can now see how emissions have changed over two decades for specific cities and regions, identify hotspots, and better track whether pledges are turning into real-world cuts in climate pollution.
Citation: Yu, Y., Wang, X., Manya, D. et al. Machine learning estimates for G20 subnational urban GHG emissions from 2000–2020. Sci Data 13, 487 (2026). https://doi.org/10.1038/s41597-026-06691-9
Keywords: urban greenhouse gas emissions, machine learning, G20 cities, climate data, subnational climate policy