Clear Sky Science · en
Large dynamic range Shack-Hartmann wavefront sensing based on a graph-theoretic computational model
Seeing Twisted Light More Clearly
Many of today’s most advanced optical systems—from giant telescopes to precision eye imagers—depend on a class of sensors that can “feel” tiny wrinkles in light waves. But when those waves are badly twisted, our standard tools get confused and fail. This paper introduces a new, software‑driven way to rescue those measurements, allowing existing hardware to see through much stronger distortions than before.
How a Grid of Tiny Lenses Reads a Wave
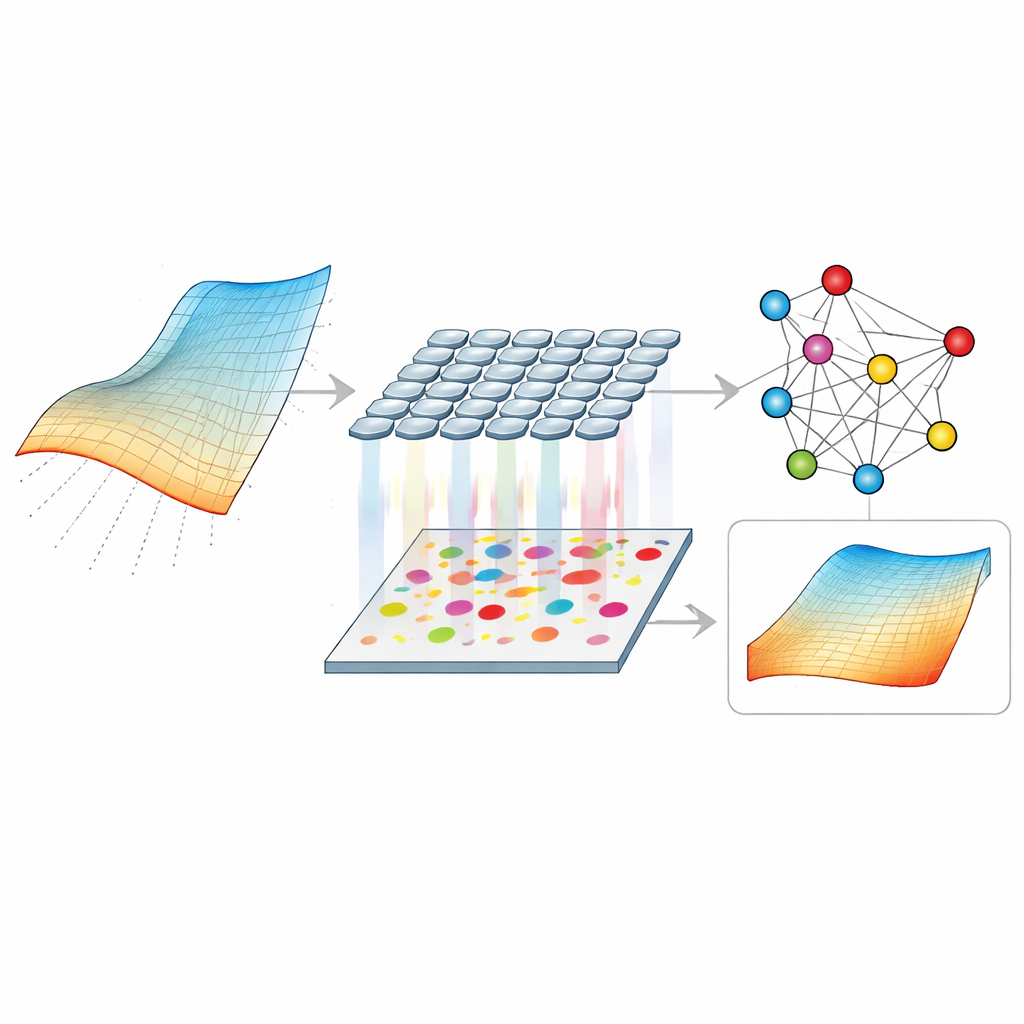
A Shack–Hartmann wavefront sensor works a bit like placing a fly’s compound eye in front of a camera. A grid of tiny lenses breaks the incoming light wave into many small beams, each forming a bright spot on the detector. If the wavefront is smooth and gentle, every spot stays neatly inside its assigned cell, and its position shift tells us the local “tilt” of the wave there. By combining thousands of these local tilts, we can reconstruct the full three‑dimensional shape of the light wave—crucial for sharpening telescope images, correcting distortion in microscopes, and stabilizing laser beams.
When Light Becomes Too Wild
The trouble starts when the wavefront is very steep or strongly distorted, as in strong atmospheric turbulence, high‑power lasers, or severely aberrated eyes. In these cases, many spots wander far beyond their home cells and overlap with neighbors, and their shapes stretch and warp. Traditional methods assume each spot stays in its own box and can be summarized by a single center point. Under heavy distortion, that assumption breaks: spots get misassigned to the wrong lens, their measured centers become unreliable, and the sensor’s usable “dynamic range” collapses. Hardware fixes—such as changing lens design or adding masks—can help but often trade sensitivity, speed, or cost for only modest gains.
Turning Messy Spots into a Graph Problem
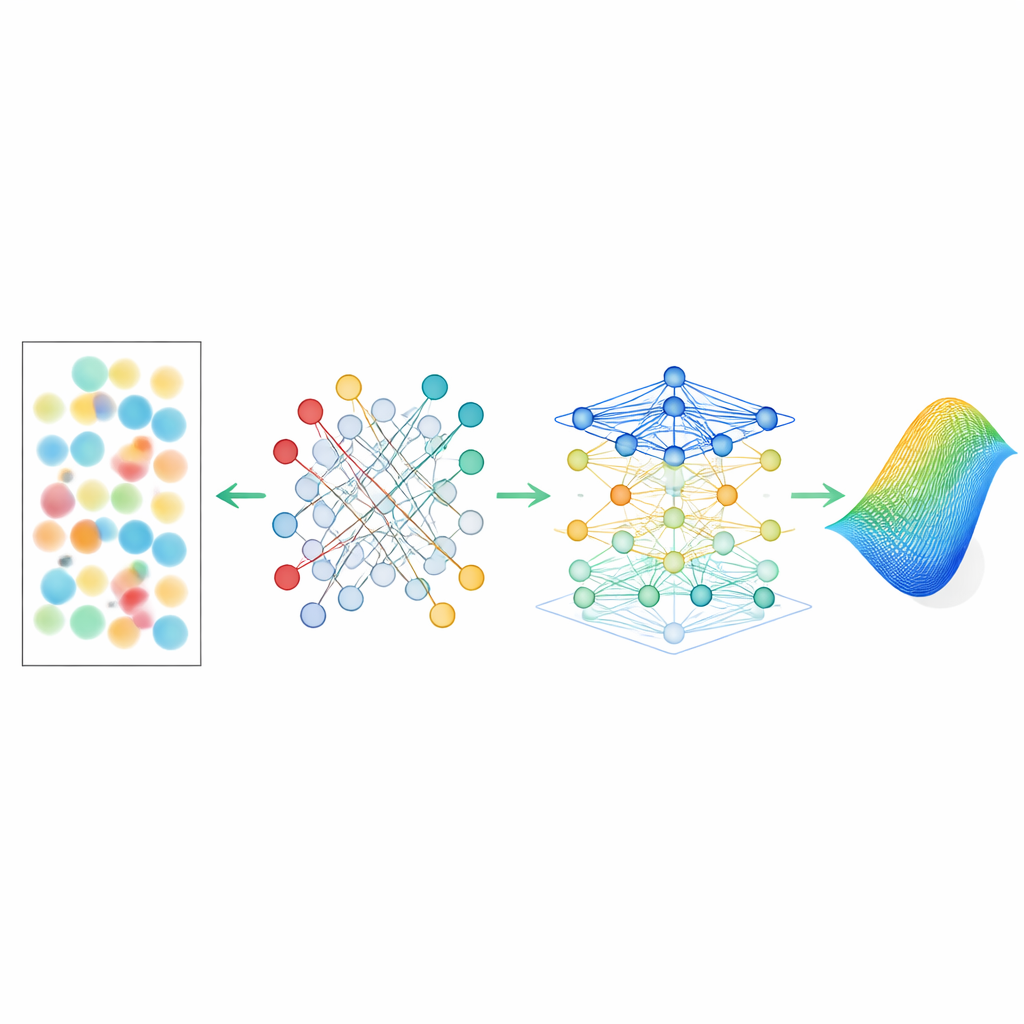
The authors propose G‑SHWS, a new computational framework that treats the scrambled pattern of spots as a matching puzzle on a graph. First, they generate a predicted pattern of spots from a trial wavefront described by a set of Zernike coefficients, a standard way to encode common distortion shapes. The measured spots and predicted spots are then treated as nodes in two groups of a weighted bipartite graph, where each possible pairing carries a cost based on distance. A specialized optimization routine searches the space of wavefront parameters to find the configuration that yields the lowest total pairing cost. As this process iterates, the predicted spots morph until their pattern closely mirrors the measured one, at which point the correct “who‑came‑from‑which‑lens” relationships can be reliably recovered—even when spots have crossed cell boundaries, overlapped, or some are missing.
Letting a Network Learn from Spot Shapes
Recovering the right pairing is only half the battle: distorted spots also carry rich information in their shapes, not just their centers. To tap into this, G‑SHWS builds a graph attention network—a form of machine‑learning model that naturally operates on nodes and links. Each spot becomes a node described by both its location and detailed shape descriptors, and each lens position is another node. Edges encode which spot belongs to which lens and which lenses are neighbors on the grid. The attention mechanism then learns how strongly each spot should “listen” to its neighbors, giving more weight to nodes that share similar distortion patterns. From this structured web of relationships and shapes, the network directly infers the underlying wavefront parameters, bypassing the crude single‑center approximation that limits conventional methods.
Pushing the Limits and Keeping Measurements Robust
In simulations, the new method extends the usable spot displacement of a typical sensor to 21 times beyond its geometric limit while still keeping reconstruction errors below about one‑twentieth of a wavelength—good enough for demanding optical work. It succeeds on a wide variety of distortion types, from simple spherical and astigmatic patterns to complex mixtures and synthetic atmospheric turbulence with very steep local slopes. Crucially, the approach also remains reliable when many spots are lost to obstructions: by inserting high‑penalty “virtual” nodes during matching and filling in missing regions with proxy spots during reconstruction, the graph model can tolerate continuous or scattered losses of a large fraction of the data without collapsing.
What This Means for Future Optical Systems
To a non‑specialist, the key message is that the authors have found a way to convert a fragile optical gadget into a much tougher, software‑augmented instrument. By reframing the problem as global pattern matching on a graph and then learning from both where spots are and how they look, G‑SHWS lets existing Shack–Hartmann sensors measure far stronger distortions than they were ever designed for, without any hardware changes. This opens the door to sharper astronomical images through turbulent air, more accurate measurements in harsh environments, and better correction of complex visual defects in the human eye—all by teaching the sensor to make smarter sense of its own messy data.
Citation: Du, L., Xu, R., Liu, S. et al. Large dynamic range Shack-Hartmann wavefront sensing based on a graph-theoretic computational model. Light Sci Appl 15, 199 (2026). https://doi.org/10.1038/s41377-026-02273-x
Keywords: wavefront sensing, adaptive optics, graph neural networks, Shack-Hartmann sensor, optical aberrations